The post Market Turmoil and Tariff Shock: Navigating Trump’s 2025 Trade Policy appeared first on Soaring Capital Management, LLC.
]]>
How Trump’s 2025 Tariff Plan is Reshaping Markets and Investor Strategy
President Trump’s “Liberation Day” trade policy has significantly disrupted global financial markets by implementing tariffs at levels not seen since the early 1900s. The market reaction has been swift and severe, leaving few safe havens.
This research note reviews the rapidly changing news flow, examines market reactions and provides context on how to approach investing during this turbulent period.
On October 15th 2024, while speaking at the Economic Club of Chicago, then-candidate Donald Trump remarked that “tariff” is his favorite word – emphasizing his strong belief in using tariffs as a tool. He went on to say that it is “the most beautiful word in the dictionary”. Click here for video clip
Most market participants may now wish they had paid closer attention to his remarks.
Below is an overview of the tariff structure announced by White House:
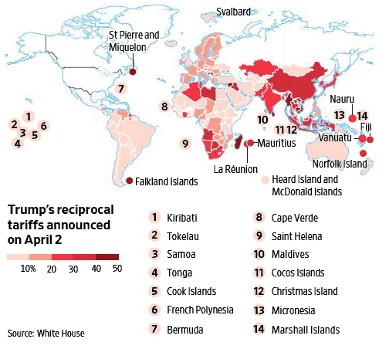
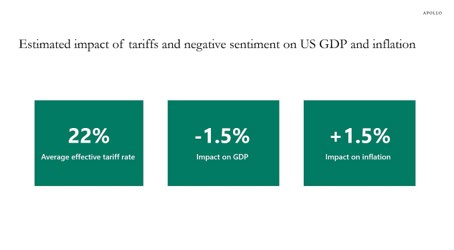
Tariffs were determined by a novel formula: the U.S. trade deficit with each country divided by imports, then halved (with a 10% minimum). This differs from traditional reciprocal tariffs and has raised questions about its economic rationale. The resulting effective tariff rate is approximately 22%.
As an example of how each tariff was determined: The U.S. exported $143b to China and China exported $438b in goods to the U.S. This resulted in a $295b trade deficit in 2024. Dividing the trade deficit by the value of imports yields 67%. Then, dividing this number by 2 results in a tariff rate of 34%.
This approach differs from traditional reciprocal tariffs and has raised questions about its economic rationale. The end result was an effective tariff rate of 22%.
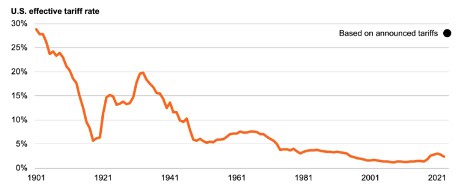
Historical effective tariff rate:
It is no surprise that the financial markets have reacted negatively. Below is a summary of market performance as of Friday, April 4:

Significant Market Reactions
*Data through April 4, 2025
Broad U.S. Markets (Year-to-Date):
- S&P 500: down 13%
- Dow Jones: down 9.5%
- Nasdaq: down 19%
- Small-Cap Equities: down 18%
Select International Markets:
- Markets in China, Brazil, the UK, France, and Germany have posted gains between 5% and 10%.
Sector Performance:
- Decliners: Communication Services, Consumer Discretionary, and Information Technology sectors are down 14-22%.
- Resilient: Healthcare and utilities remain unchanged; consumer staples have posted gains.
Safe Havens:
- Gold: up 15%
- U.S. Bonds: up 4%
Currency Movement:
- The U.S. dollar has declined against major currencies—an unusual occurrence during risk-off periods.
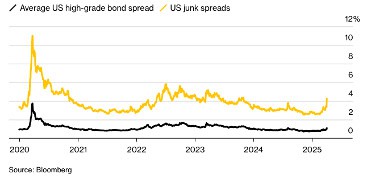
Credit Spreads:
- Corporate and high-yield credit spreads have widened significantly (to 109 and 427 basis points, respectively), reflecting increased market risk.
Volatility:
- The VIX index has spiked to 45.
Bond Market Expectations:
- The market is now pricing in five rate cuts by the Federal Reserve.
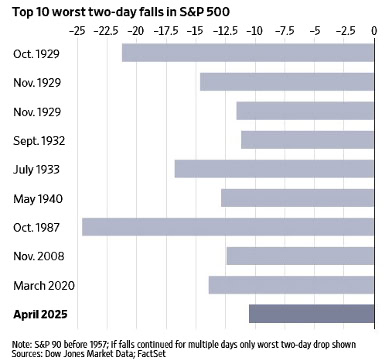
In historical context, these market reactions rank in the top 10 of two-day market declines going back to 1929!
Negotiating Salvo?
While financial markets reacted sharply, some analysts speculate this is an opening gambit. Treasury Secretary Bessent hinted the tariffs are a “ceiling” suggesting room for negotiation. Meanwhile Commerce Secretary Lutnick emphasized the goal of creating “a world of fairness.”
If Trump sticks to these tariffs, it will mark a major shift from cooperation to coercion in global trade that could have long-term consequences for U.S. economic influence and dollar dominance.
Historical evidence suggests that trade wars rarely reduce trade deficits or reverse the decline in manufacturing jobs, even for countries with trade surpluses. While there is merit in ensuring that the U.S. retains the capability to produce certain strategic and defense-related goods, many consumer products—such as apparel, footwear, or toys—benefit from international production efficiencies. Moreover, many U.S. manufacturers rely heavily on imported inputs (e.g., steel, aluminum, wood) to produce high-value goods. Taxing these imports could force manufacturers to either accept lower margins or pass on higher costs to consumers—both scenarios that are not favorable for financial markets.
Separately, we do believe that there are a significant number of unfair trade barriers, limits and quotas, non-tariff barriers and regulations that affect U.S. companies’ ability to operate freely in international markets.
It is worth noting that approximately 44% of the imports into the U.S. are used in finished goods that are made in the U.S. Steel, Aluminum, wood to name a few imports, are all heavily used by U.S. manufactures to make high value goods.
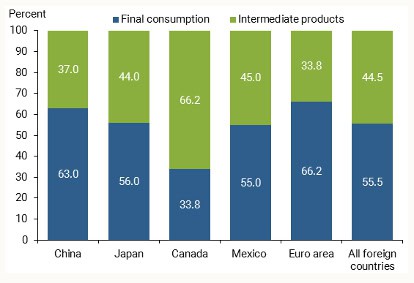
If we tax these goods, the makers of these products will either have to make lower margins or pass the added costs on to consumers. Either way this is not a positive scenario for the financial markets.
Investment and Economic Implications
Data from Apollo Asset Management suggests that a 22% effective tariff could reduce U.S. GDP by around 1.5% and increase inflation by a similar amount. Such a scenario would create a classic stagflation environment—simultaneously hampering economic growth and pushing up prices. In this scenario, the S&P 500 could potentially decline an additional 13-15% from current levels, pricing the index near 4,400 and compressing its P/E ratio to around 16. While this is not a forecast, it underscores the need to prepare for further volatility and to view any significant market declines as potential buying opportunities.
What is Working in this Crisis?
It is always instructive to observe how markets react in crises. This gives us a read through to positioning of participants and a road map to how to invest. Generally, the market behaved as expected with the exception of the weakness in the dollar.
- International Equities: International equities are offering stability, likely due to a rebalancing away from heavy U.S. equity weighting and under-valuation of foreign equity markets.
- Mid-Cap vs. Large-Cap: Mid-cap stocks are outperforming large caps, possibly due to an overweight in large-cap holdings.
- Bonds: Bonds are providing a safety net amid a flight-to-quality environment, supported by expectations of Federal Reserve rate cuts.
- Sector Analysis: Cyclical and discretionary sectors, particularly those reliant on imports, are more exposed to declines, while domestic consumer staples, utilities, and real estate tend to hold up better.
Strategic Recommendations
Our investment approach is built on balance diversification, avoiding heavy concentrations in any single company, sector or geography. We attempt to allocate to where there is value and non-correlated assets. This led us to have heavier allocations to foreign markets, gold, quantitative strategies, private credit, bonds and tilt away from large cap growth equity.
When we invest for our clients, we take a balanced approach and we do not have large concentrations in any one company, sector, asset type or geography. In addition to a blend of US equity, our current portfolio allocations include gold, international equity, quantitative strategies, private credit and bonds. This posture has provided outstanding relative performance.
While we will generally stay the course, we will look for tax loss harvesting opportunities. This refers to selling any holdings that might be at a loss. This action captures the tax loss which can b be used to offset gains. We then will then buy similar securities to maintain the same exposure. While this won’t create performance it will improve after-tax returns.
This diversified posture has historically delivered strong relative performance. We recommend:
- Maintain Long-Term Perspective: Market volatility is normal; reactive decisions often prove counterproductive
- Embrace Diversification: Ensure you hold a balanced mix of asset classes, sectors, and geographies
- Focus on Quality: Prioritize financially strong companies with sustainable business models
- Review Liquidity Needs: Ensure portfolio alignment with short/medium-term requirements
- Consider Rebalancing: Market dislocations may offer opportunities to adjust allocations
One has to keep in mind that the S&P 500 has never been down more than 10% at the end of any 5-year period following all-time highs and that the difference between investing at market highs only resulted in a 1% lower return through time. Staying invested and balanced resulted in the best long-term outcome.
Second Order Effects
If these tariffs become permanent, we may see some countries retaliate with reciprocal tariffs, as China has done. Other nations may be forced to accept the tariffs, prompting companies in those countries to innovate and improve efficiency to offset the added costs. In contrast, U.S. manufacturers may stagnate if shielded by tariff protections, potentially reducing incentives for innovation—a pattern similar to the decline of British manufacturing in the late 19th century as the U.S. emerged as the global industrial leader.
Additionally, there may be a realignment of global trade relationships. Countries outside the U.S. sphere of influence might increase bilateral trade—such as between Europe and China, or Japan and China. On the policy side, the tariffs might drive efforts to reduce the U.S. fiscal deficit, as lower tax revenues and higher debt servicing costs could eventually choke off economic growth.
The benefits of the tariffs outside of potentially bringing some manufacturing back to the U.S., might be that they raise significant revenue. Capital Economics estimates that the tariffs will create $700b in incremental revenue. This revenue can be used to reduce the debt and/or reduce taxes. There are a lot of assumptions in this figure, but nonetheless the tariffs should be net revenue positive for the U.S.
Any additional revenue is of major importance to the long-term health of the U.S. The U.S. has not had a balanced budget in 24 years. If tariffs can lead to more revenue we can help reduce this imbalance. Today, the U.S. total debt is $35 trillion and growing. While I am skeptical of the amount of money that tariffs can bring in, any revenue should be a net positive from a debt perspective.
Conclusion
While President Trump’s trade policies have created significant market disruption, history suggests that disciplined investing remains paramount. The shock from these tariffs may be temporary, and a swift policy reversal could trigger a market rebound similar to past episodes. The current environment is markedly different from the broad-based economic weakness seen in the 20028 Great Recession – it is largely self-imposed and may be reversible. Whether it will be reversed is the big unknown.
What we know about Trump is that he wants a deal. In this game of global economic chicken, will he be able to claim a victory and score a deal in the near term? No one knows for certain, but my money is that he will at least arrive at a compromise.
What we do know is that if you have a well-balanced portfolio, that is client-appropriate, tends to yield better long-term results than attempting to time the market.
The core economic drivers—employment, monetary policy, corporate earnings, and fiscal policy continue to provide a solid foundation for potential market recovery.
Brian F. Moss, CFA
Founder and CEO
Soaring Capital Management, LLC
Click here to read additional research from Soaring Capital
We help you chart the path that leads to your financial success.
Disclosures*
This research note is for illustration and discussion purposes only. It is not intended to be, nor should it be construed or used as, investment, tax, ERISA or legal advice, nor any recommendation of, or an offer to sell, or a solicitation of any offer to buy, an interest in any security. Advisory Services are only offered to clients or prospective clients where Soaring Capital Management, LLC and its representatives are properly licensed or exempt from licensure. Investing involves risk and possible loss of principal capital. No advice may be rendered by Soaring Capital Management, LLC unless a client service agreement is in place.
Pro-forma portfolio illustrations shown are represented gross of advisory fees and expenses and presumes the reinvestment of investment income. Any descriptions involving investment models, statistical analysis, investment process and investment strategies and styles are provided for illustration purposes only. Client investments will vary based on the unique goals, objectives and other factors. No representation or warranty is made that any Soaring Capital Management, LLC investment portfolio, process or investment objectives will or are likely to be achieved or successful or will make any profit or will not sustain losses. Past performance is not indicative of future results.
The information contained herein is as of the date indicated, is not complete, is subject to change, and does not contain all material information, including information relating to risk factors. Any assumptions, assessments, intended targets, statements or the like (collectively, “Statements”) regarding future events or which are forward-looking in nature constitute only subjective views, outlooks, estimations or intentions, are based upon Soaring Capital’s expectations, intentions or beliefs, should not be relied on, are subject to change due to a variety of factors, including fluctuating market conditions and economic factors, and involve inherent risks and uncertainties, both general and specific, many of which cannot be predicted or quantified and are beyond Soaring Capital’s control.
Future evidence and actual results could differ materially from those set forth in, contemplated by, or underlying these Statements. In light of these risks and uncertainties, there can be no assurance and no representation given that these Statements are now or will prove to be accurate or complete in anyway. Soaring Capital undertakes no responsibility or obligation to revise or update such Statements.
Return targets or objectives, if any, are used for measurement or comparison purposes and only as a guideline for prospective investors to evaluate a particular investment program’s investment strategies and accompanying information. Targeted returns reflect subjective determinations by Soaring Capital based on a variety of factors, including, among others, investment strategy, prior performance of similar products (if any), volatility measures, risk tolerance and market conditions. Performance may fluctuate, especially over short periods. Targeted returns should be evaluated over the time period indicated and not over shorter periods. Targeted returns are not intended to be actual performance and should not be relied upon as an indication of actual or future performance.
This research note is not intended for distribution to or use by any person or entity in any jurisdiction or country where such distribution or use would be contrary to local law or regulation.
The post Market Turmoil and Tariff Shock: Navigating Trump’s 2025 Trade Policy appeared first on Soaring Capital Management, LLC.
]]>The post Investing in Private Equity at a 20% Discount appeared first on Soaring Capital Management, LLC.
]]>

Private equity has long been the domain of institutional investors, delivering superior returns and reshaping the business landscape. Now, a unique market opportunity is allowing individual investors to access this “superior form of capitalism” at unprecedented discounts.
Are you intrigued by the potential of private equity but deterred by the high minimum investment requirements and limited liquidity?
In this article, we’ll explore a unique opportunity to invest in private equity. We’ll reveal fund structures that allow accredited investors to access this asset class with greater flexibility and potential for exceptional returns.
For those who want to do a deep dive, we provide a brief history of private equity covering how some of the top Ivy League universities employ private equity produce class leading returns. We will cover:
- Private equity background including historical returns
- Details on what makes private equity unique
- New fund structure innovations
- How to buy private equity at a discount
- Secondary private equity fund market overview
Private equity offers a compelling opportunity for investors seeking superior returns. With current market conditions creating unique discount opportunities, now may be the ideal time to add this asset class to your portfolio.
Introduction: What is Private Equity?
Private equity in the most simplistic terms is equity ownership held in a private business. Private equity firms are run by general partners (also called sponsors). General partners invest money raised from investors who work together for a limited amount of time, aptly named “limited partners.” Private equity firms are sometimes called buyout firms. As the word indicate these firms typically buyout an entire business. Usually the buyouts happen with a portion of equity and a portion of debt (leverage buyout).
This is not a new concept as the idea of buying a company with a pool of investors’ capital dates back over 100 years.
The Changing Landscape of Investing
Private equity firms owns a significant number of companies. It is estimated that they own over 16,000 US companies and represents approximately $5 trillion of capital.
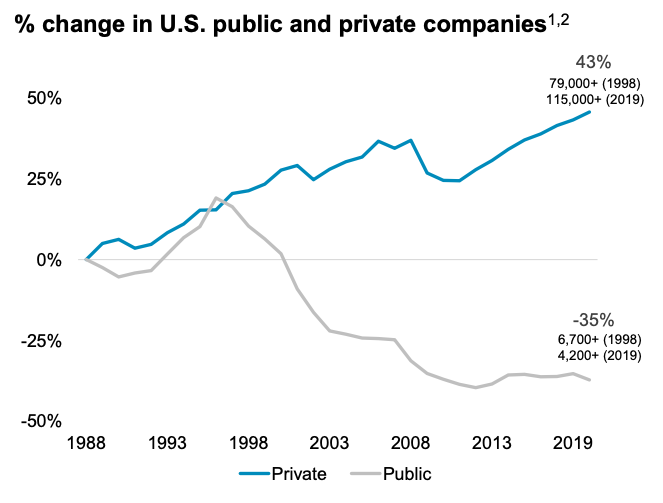
Since 1988, the number of public companies has declined by 35%, and the number of private companies has increased by 43%. This represents a dramatic shift in ownership; out of the public and into the private markets. Many more companies are choosing to remain private. Not investing in high growth and innovative companies via the private markets is potentially missing a lot of return.
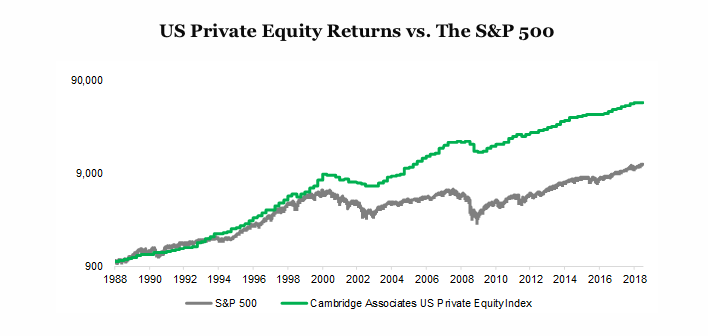
Outperforming Public Markets
The institutional consulting firm Cambridge Associates produces a private equity returns index. Their index is a reasonable representation of historical returns. Their analysis shows that over the past twenty five years private equity has provided investors with annualized returns of +13.03%. This compares to the MSCI World return of +7.4% and the S&P 500 of 6.2%.
A million dollars invested in 1988 turns into $21m at this compounded rate versus $4.5m for the S&P.
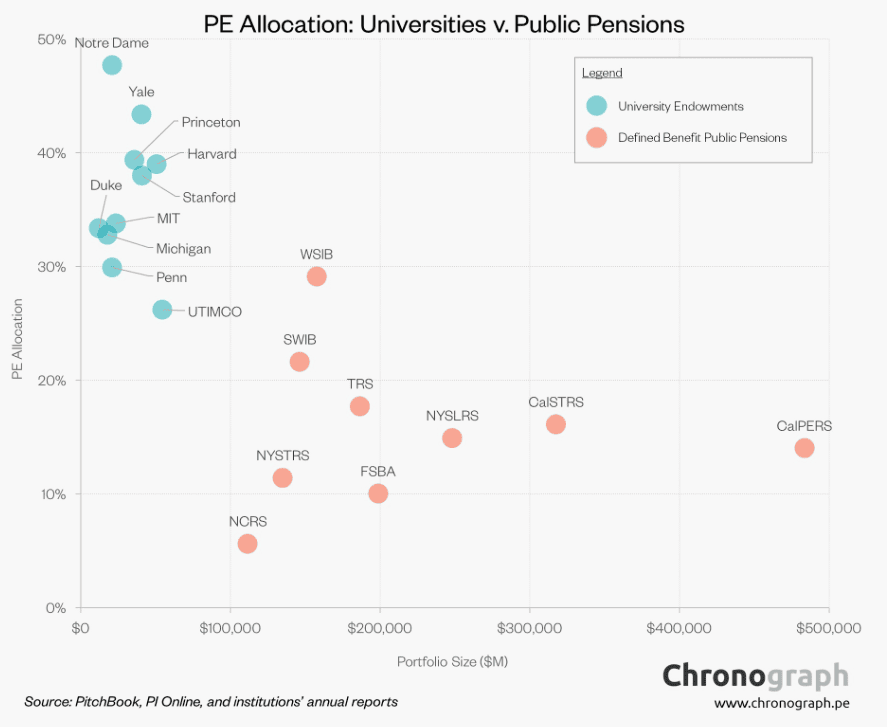
The long-term returns of private equity are one of the reasons why Yale University and other Ivy League endowments have generated such outstanding performance.
David Swensen, Yale’s legendary Chief Investment Officer, in a discussion with Robert Rubin (the former US Secretary of Treasury), referred to private equity as “a superior form of capitalism”.

What Swensen meant by this was that private equity had long-term, patient capital and full control to drive changes. Characteristics that are not always present in public listed companies. Sometimes, the corporate changes that are needed can be hard and require a complete rework of strategy, management, operations and governance. For a public company, making the needed changes is much harder as there tends to be a shorter-term focus on meeting or exceeding quarterly earnings estimates.
Not only can private equity general partners often get changes accomplished, they often have better insights as to the right changes to make. The best private equity firms often have deep industry knowledge, deal-making abilities, operations experience, vast resources, and creativity to add value. Most importantly, they act as owners.
Over David Swensen’s time managing Yale’s endowment, he produced annualized returns of 13.7% which was 3.4% greater than the average endowment. In dollar terms, he produced over $21 billion of gains for Yale! One dollar invested in 1985 turned into $103 versus $50 for the S&P over the same time.
Clearly, not all of Yale’s returns were generated by private equity, but it did account for a large percentage of his allocation and return. The chart below compares Yale’s allocation (weighting) to private equity relative to other universities and to a select group of public pension funds.
Owner Mentality Creates Better Outcomes
You may recall that I worked as an activist investor with Barington Capital. At Barington, we attempted to unlock value by effecting changes at companies that we felt were undervalued. Chief executive Jim Mitarotonda, was frequently envious of private equity. As public company investors, we had minority ownership and were outsiders looking in. We had to change public shareholder opinion and attempt to sway the board that we had a better plan to get anything done. While Barington was effective at this, it was hard.
Meanwhile, private equity-controlled companies have 100% control and can do as they wish. There is 100% alignment of interest with the goal of bottom line returns for shareholders.
Furthermore, publicly listed companies are managed by executive teams and boards of directors that typically don’t have much ownership stake. This weak alignment of interests can contribute to lackluster performance.
At Barington, we examined numerous cases where CEOs were paid tens of millions of dollars while shareholders had no return or even negative returns, and yet it was still hard to get the board to make the much-needed changes.
This is not to say that private equity always has the answer. They can’t create growth at will, but more often than not, they can figure it out. Operating as an owner and entrepreneur can be very powerful.
Private equity is far from perfect, but criticisms of the industry often miss the big picture. Criticisms typically highlight a small subset of the industry or view performance over a very short timeframe. To get a taste of the criticisms, it is worth reading about a bill that Elizabeth Warren recently put forth to bar private equity from investing in the healthcare sector.
Private Equity for Accredited investors
Typical private equity fund investments in a traditional fund structure require a minimum commitment of $1m to $5m or more and therefore are out of the reach for many investors. Additionally, these investments require the investor to lock up their money for 10 years or more.
Under the traditional private equity fund structure, the investor needs to sign an agreement committing to invest in the private equity fund and then be ready with short notice to remit money. A lack of clarity around when the private equity fund will return investors’ money adds to uncertainty. While most funds are structured with finite lives, private equity funds have some flexibility to extend the ending date. This flow of funds dynamic makes it difficult to manage portfolios that contain private equity. This is one of the downsides of investing private equity via traditional fund structures.
Fund Structure Innovation – Evergreen Funds
While the majority of private equity funds are structured and operate as traditional (so called GP/LP vehicles), there have been some innovations in this area.
I am referring to evergreen funds (also called interval or tender offer). These fund structures allow investors to avoid the difficulty of managing the funding uncertainty, provide better liquidity, and accept a broader range of investors.
When investing in an evergreen fund, the investor’s capital is called upfront and is put to work immediately in the pool of assets that the fund owns. When one wants to redeem from an evergreen fund, the investor needs to provide advanced notice but the capital can normally be returned on a quarterly or semi-annual basis. [This is provided that not more than a certain threshold of total fund capital is requested at any one redemption period. Typically, this threshold is 2.5% to 5% of net asset value.]
During most environments, this fund level liquidity should be sufficient, but it is not guaranteed. Anytime there is a mismatch between the liquidity offered to investors and the liquidity of the underlying holdings, there can be issues.
On balance, it is my belief that the evolution of the evergreen fund structure is a positive development that has more positives than negatives.
The Current Opportunity: Buying at Discount
There are some very interesting dynamics happening in the private equity and venture capital sectors at the moment that are allowing investors to buy at significant discounts.
– Why do these discounts exist?
To understand how these discounts have come about, it requires an overall understanding of the private equity market, investors, and structures.
The outline from KKR provides a high level overview of the typical private equity fund structure
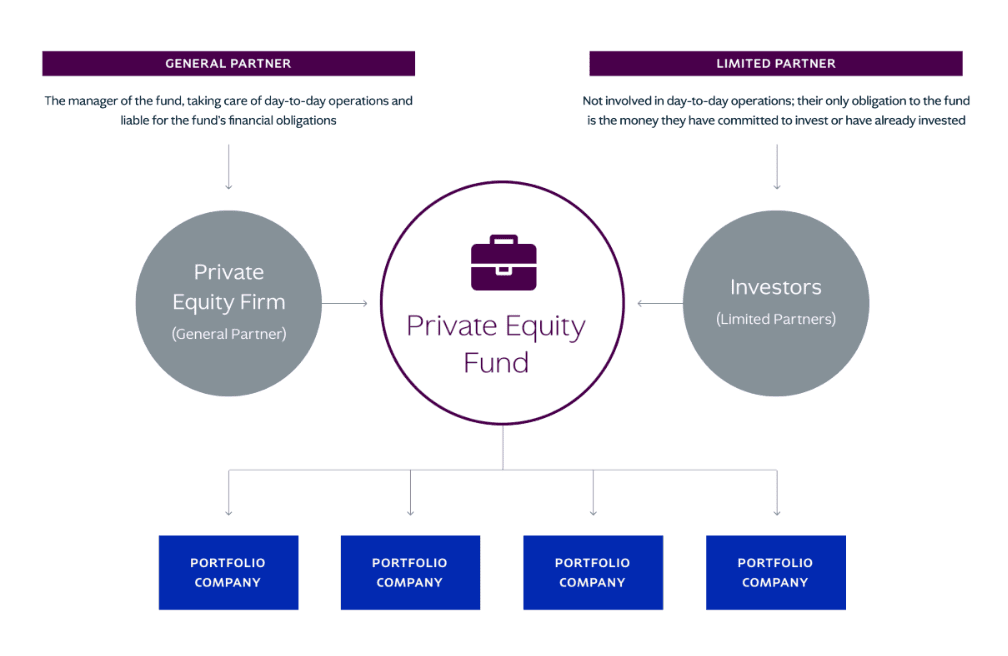
As discussed earlier, the vast majority of $5 trillion invested in private equity is invested in traditional private equity fund structures. These structures obligate the investors or limited partners (LPs) to:
1) Provide the private equity fund with capital when they receive a capital call and; 2) Obligate the investor to be patient and hold the private equity fund shares for a period of 8-10 years. The graph below explains the life cycle of typical private equity investments.
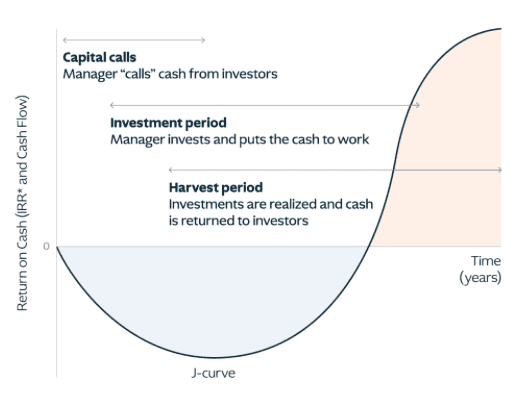
When a private equity general partner (GP) creates a new private equity fund, they typically haven’t yet identified any underlying investment targets to buy. When an LP is investing at this point, investors are making commitments to what is called a blind pool. LPs commit a certain dollar amount which will need to be sent to the private equity fund upon request (capital call). Capital is called as investments are identified for the private equity fund to buy. This period of time is referred to as the Investment Period.
After the private equity fund makes acquisitions, it then works to unlock/create value for these companies, therefore increasing the net asset value of the total portfolio. As time passes and values increase the private equity fund will look to monetize or sell holdings and then return the proceeds back to LPs. This period is called the Harvest Period.
In normal environments for private equity, the investment period will be between 2-4 years and the harvest period will be 6-8 years. Along this timeline, capital is typically returned to investors ahead of the full 10 year fund life. As an example, an LP investor might commit $10m to a private equity fund on day one. Half of this commitment might be called at the end of year one, and the other half called at the end of year two. In year five, some of the portfolio holdings will have matured and been sold; therefore, the fund will return some capital back to LP investors. The remaining capital might be harvested and returned to LPs in year 8, and the fund is then closed out.
Market Dynamics Creating Discounts
Now that we understand the typical flow of capital when investing in private equity, let’s look at how investors manage portfolios of private equity.
The majority of investors in private equity are institutional investors (university endowments, pension funds, and sovereign wealth funds). These entities are tightly managed and guided by institutional consultants and investment boards. As a result, these investors have to abide by a strict strategic asset allocation. This allocation prescribes how much is allowed to be invested in each different type of investment. As an example, a typical board might prescribe an allocation to private equity in a band of 15% to 20% of the total assets.
Managing investments into private equity funds is difficult due to the uncertainty around the timing and amount of capital calls during the investment period and the timing and amount of return of capital during the harvest period. The trick is to understand when commitments will be called and when capital will be returned. Most investors in private equity base their commitment decisions on the historical returns of capital.
Over-Committed and Under-Harvested
What has happened recently is that many investors are now over-committed to private equity and venture funds due to the muted amount of harvests. Therefore, many investors find themselves in a situation where they are above their prescribed allocation limits for the asset class.
Harvests/return of capital have been slower than usual, while at the same time, the amount of new capital commitments has remained strong. This situation is analogous to buying a new house in advance of selling your old one. You need to come up with the funds to buy the new house before you receive the proceeds from the sale.
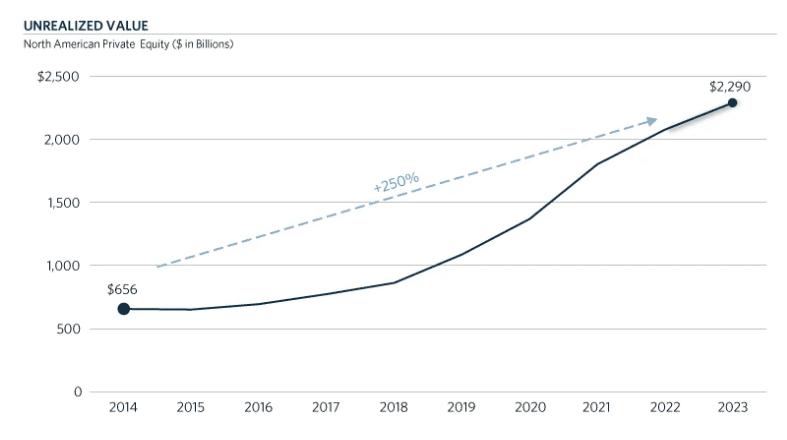
The amount of private equity harvests have been reduced largely due to the rise in interest rates and the lackluster IPO and M&A markets, among other factors. The chart below shows the amount of unrealized holdings in private equity.
Because investors are over-allocated/over-committed, they are looking to sell their private equity fund interests (LP Interests) on the secondary market.
The investor might really like their private equity fund investment, but they need to sell to get their overall portfolio back into balance. As a result of this need to sell, the investors are willing to accept a reduction from the current value of the shares. In some cases, the discount is 20%. We like buying $1 for 80 cents!
General Partners Also Need to Sell – Continuation Funds
The general partners (GPs) or managers of the private equity funds are also feeling the pressure from their investors. Not only do the GPs need to provide good returns, they also need to return capital to their LPs within the expected time. If the GP’s investors are not happy with the amount and timing of the return of capital, they are less likely to invest in the successor funds from these private equity firms.
Since a significant amount of the profit that GPs earn is only realized once the private equity fund sells their investments and returns capital to LPs, they are incentivized to sell assets. However, the amount of profit (carried interest) that a GP earns is based on the amount of profit that they make for their LPs. Therefore, GPs will normally only want to sell assets when they think they are being compensated appropriately.
Since harvests have been muted, the GPs are not able to get, what they perceive, as the full value for their holdings. Because of this dynamic, GPs are choosing to create so-called continuation funds.
Continuation funds allow the GP to provide liquidity to original LPs and for the GP to defer the selling of their assets until the pricing is better. Continuation funds are set up by GPs typically in partnership with secondary private equity funds.
A continuation fund assumes ownership of all or a portion of the private equity portfolio. This allows the GP to provide liquidity to the original LPs who want/need liquidity and at the same time allows to them hold on to prized assets that they think offer continued growth prospects. The GPs will typically roll over their ownership in the continuation fund and continue to defer their carried interest therefore, maintaining alignment.
Private Equity Secondaries Opportunity:
The secondary private equity market has existed for a long time, but today it is having its day in the sun.
Over the previous three years, the private equity secondary market has had transaction volume of over $100b per year. There are dedicated investment firms that exclusively focus on the private equity secondary market, with some having track records that go back 30 years. The best ones have great long-term relationships with both GPs and LPs to source the best opportunities.
Benefits of Investing Now?
Private equity secondaries are particularly attractive investments now due to several factors:
- Discount – The level of discounts that buyers are able to negotiate is larger than it has been historically. Some funds are purchasing LP and GP interests at 20% discounts.
- Amount of Deal Flow – Given the dynamics described with institutional investors being over committed to private equity, there is a large amount of deal flow available.
- Access – Given the creation of the evergreen/interval fund structure, accredited investors can now participate in this asset class.
- Liquidity – The evergreen fund structure offers significantly better liquidity than traditional private equity.
- Potentially Better Returns – When looking at the historical returns of secondary private equity fund managers, we observe that returns have been very strong with net returns in the mid to high teens percentage annualized rates of return. While we don’t have a crystal ball, we would expect these numbers to hold over a full market cycle. Not only does buying at discounts improve the return, but by investing in an evergreen fund, you eliminate most if not all of the traditional private equity J-curve.
- No Blind Pool Risk – When buying in the secondary market, you know exactly what you are buying, which affords the private equity secondary fund the ability to do a complete analysis of each underlying holding.
- Reduced Risk Overall – By nature, the companies that are purchased in the secondary market are more seasoned and further along their growth trajectory. Having a more seasoned company affords more data for analysis and less uncertainty about the growth path.
- Speed of Deployment – Investors’ money is put to work on day one. Investing in an evergreen fund allows you to quickly deploy capital. Having a shorter investment period versus a traditional fund is not only easier to manage, it potentially increases overall portfolio return as the investor doesn’t have to set aside money for traditional private equity fund capital calls.
Conclusion
Private equity has been one of the best places to invest.
However, as typical disclaimer language states, “past performance is no indicator of future results”. With that said, I find the wise words of Mark Twain are particularly apt in that ‘history doesn’t repeat, but often rhymes”.
Will future private equity performance rhyme with the past? We believe that well executed private equity investments with the right general partner are structurally superior. There are downsides such as fees and illiquidity; however, for the right investor with the right risk profile and time horizon, we think that these are worthy trade-offs.
Current trends suggest that investing in private equity secondaries could offer even greater returns than traditional private equity.
Given the increasing prevalence of private companies, we believe that exposure to a segment of high-growth private companies at discounted valuations is a wise investment strategy
Together with our advisors and broad industry network, we have completed extensive diligence to source the best ways to allocate to this sector. We have identified two funds that are believe are compelling to add to our client portfolios.
If you found this article interesting and would like to learn more about how Soaring Capital thinks about private equity and more broadly how we help our clients reach their investing goals, please reach out.
Will private equity be a superior form of capitalism? We think it will.
Thank you for your observations, Mr. Swensen!
All the best,
Brian F. Moss, CFA
Click here to read additional research from Soaring Capital
We help you chart the path that leads to your financial success.
Disclosures*
This research note is for illustration and discussion purposes only. It is not intended to be, nor should it be construed or used as, investment, tax, ERISA or legal advice, nor any recommendation of, or an offer to sell, or a solicitation of any offer to buy, an interest in any security. Advisory Services are only offered to clients or prospective clients where Soaring Capital Management, LLC and its representatives are properly licensed or exempt from licensure. Investing involves risk and possible loss of principal capital. No advice may be rendered by Soaring Capital Management, LLC unless a client service agreement is in place.
Pro-forma portfolio illustrations shown are represented gross of advisory fees and expenses and presumes the reinvestment of investment income. Any descriptions involving investment models, statistical analysis, investment process and investment strategies and styles are provided for illustration purposes only. Client investments will vary based on the unique goals, objectives and other factors. No representation or warranty is made that any Soaring Capital Management, LLC investment portfolio, process or investment objectives will or are likely to be achieved or successful or will make any profit or will not sustain losses. Past performance is not indicative of future results.
The information contained herein is as of the date indicated, is not complete, is subject to change, and does not contain all material information, including information relating to risk factors. Any assumptions, assessments, intended targets, statements or the like (collectively, “Statements”) regarding future events or which are forward-looking in nature constitute only subjective views, outlooks, estimations or intentions, are based upon Soaring Capital’s expectations, intentions or beliefs, should not be relied on, are subject to change due to a variety of factors, including fluctuating market conditions and economic factors, and involve inherent risks and uncertainties, both general and specific, many of which cannot be predicted or quantified and are beyond Soaring Capital’s control.
Future evidence and actual results could differ materially from those set forth in, contemplated by, or underlying these Statements. In light of these risks and uncertainties, there can be no assurance and no representation given that these Statements are now or will prove to be accurate or complete in anyway. Soaring Capital undertakes no responsibility or obligation to revise or update such Statements.
Return targets or objectives, if any, are used for measurement or comparison purposes and only as a guideline for prospective investors to evaluate a particular investment program’s investment strategies and accompanying information. Targeted returns reflect subjective determinations by Soaring Capital based on a variety of factors, including, among others, investment strategy, prior performance of similar products (if any), volatility measures, risk tolerance and market conditions. Performance may fluctuate, especially over short periods. Targeted returns should be evaluated over the time period indicated and not over shorter periods. Targeted returns are not intended to be actual performance and should not be relied upon as an indication of actual or future performance.
This research note is not intended for distribution to or use by any person or entity in any jurisdiction or country where such distribution or use would be contrary to local law or regulation.
The post Investing in Private Equity at a 20% Discount appeared first on Soaring Capital Management, LLC.
]]>The post 10 Proven Moves to Boost Your Finances Before 2024 Hits! appeared first on Soaring Capital Management, LLC.
]]>
While we can’t control the economy, markets or tax policies, crafting a well-structured plan empowers us to achieve our financial goals.
In this article, I outline ten actionable items that will set you up for a successful 2024. You will learn tax-saving strategies, investment moves, retirement planning tips, and more.
1) Investment Moves
✓ Rebalance your portfolio
This year proved to be a year of haves and have-nots. Some investments had outstanding performance while many had flat to slightly positive returns. A market like this typically requires a portfolio rebalance to stay in line with desired asset allocations and risk tolerances.
Many names in the S&P have had gains of 50% or more this year. Nvida was up +230%, Salesforce up +97%, Amazon up 78%, Tesla up +103%, etc. If you held these companies, and others, it might be prudent to examine if their valuation is warranted relative to their growth rates. Additionally, it is worth examining if their appreciation has caused your portfolio to be unduly concentrated in a sector or in a single name.
✓ Avoid chasing past performance
Stick to an asset allocation plan and do not chase yesterday’s winners. The market tends to move in cycles and chasing a cycle is often not a path to long term success.
✓ Evaluate weighting to cash
With short term yields on money markets offering around 5% interest, it is tempting to have a large weighting to this risk free asset. However, this can be dangerous in the context of meeting your long term goals. One should stick to a strategic asset allocation plan and have an appropriate amount of cash.
Separately, if you have cash sitting in a bank earning next to nothing, the incentive to move money out of the bank remains stronger than ever.
✓ Consider an Investment Policy Statement (IPS)
Having a clearly written investment policy provides a measure of discipline. This captures goals, risk tolerance and other considerations to help achieve your objectives and avoid market noise.
2. Required Minimum Distribution (RMD)
If you are 73 years old and older, you must take a required minimum distribution from your tax deferred accounts. Failure to take this withdrawal, will subject you to a penalty of 50% on the not withdrawn amount. If you don’t need your RMD cashflow, it is worth exploring options such as donating some or all of your RMD to a charity via a Qualified Charitable Distribution (QCD).
3. Charitable Giving
When it comes to charitable giving, there are numerous creative options that should be explored:
✓ Qualified Charitable Distribution
Using a Qualified Charitable Distribution to satisfy your RMD provides a triple benefit. For one, it satisfies your need to take RMD. Second, the distribution is not counted as income, which reduces your tax obligation. Lastly, it benefits the charity.
✓ Donate Appreciated Stock or other Non-Cash Assets
If you need to rebalance your portfolio and/or have a large concentration in a single position, it might make sense to donate some or all of the investment versus selling it and donating the cash proceeds. Not only will this provide a deduction and therefore reduction in your taxes, it will also eliminate the capital gains tax you would have to pay.
✓ Donor Advised Fund (DAF)
Use a donor advised fund to donate your assets. This allows you to receive the tax deduction for the current value of the assets in the year of donation. Additionally, it allows you to retain control over how the assets are managed, when the assets are sold and when and which charities ultimately receive the funds. You can choose to have the assets grow within the DAF and then later donate the funds to charities.
✓ Bunch Charitable Contributions
Bunching multiple years of contributions into a single year might allow you to get over the IRS standard tax deduction amounts and into the itemized deduction category. Doing so might allow you to reduce your overall tax obligation via charitable contributions versus donating the same amount each year. If you marry “bunching” with a donor advised fund donation, you are still able to donate to your favorite charities each year.
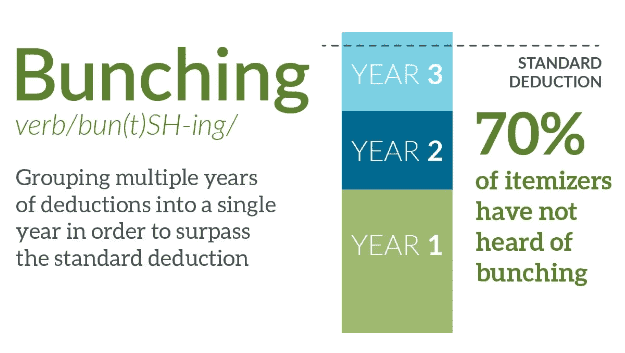
We have a calculator that will allow you to calculate if bunching makes sense for you.
Click here to use the calculator:
4. Roth Conversions
A Roth Conversion transfers your tax deferred assets into tax exempt assets. Doing this requires you to pay taxes on the converted amount in the current tax year. However, once the taxes are paid, these assets are tax-free even after they might grow and compound in value.
Additionally, these converted assets are not subject to required minimum distributions and are not counted as income for tax purposes. Having lower reported income in retirement has the benefit of reducing your medicare insurance premiums.
With the US government spending significantly more than it is collecting, it is highly likely that future tax rates will need to be increased to cover our budget deficits. If tax rates are likely to increase, it makes it a more compelling argument to convert some or all of your IRA, SEP IRA, SIMPLE IRA, or 403b plan into a Roth either this year or next.
It is important to evaluate your personal income and tax situation before making this change. However, if you determine that your income will be higher in the future or you plan on moving to a higher tax state, this might be a smart money move. If the tax burden of a lump sum conversion is too high, you could consider spreading if over several years.
Note: I typically advocate for a balance of tax deferred and tax exempt assets. I will examine many factors such as age, future income, tax policy, inheritance and others when working with clients.
5. Review Beneficiary Designations
Retirement account and life insurance policy beneficiary designations supersede the directives laid out in a will. Therefore, it is important to review these to ensure that they are set up in accordance with your wishes.
This is especially important if someone in your family recently passed away or if family dynamics changed.
Having assets pass to someone you do not want to is not an unheard occurrence (such as an ex-spouse). This is a good reminder to ensure retirement and life insurance account beneficiaries align with your current wishes.
6. 529 College Savings Accounts
As someone who is personally facing large college/university tuition bills over the next 7 years, I am keenly aware of the cost of higher education. Many private schools total cost of attendance (COA) is in the mid $80k per year! Therefore it is imperative to do long term financial planning for this expense.
Using a 529 Account can help save for school as well as provide a full or partial state tax deduction on the amount of the contribution. Over 30 states provide this benefit. Additionally, distributions from 529 plans are excluded from taxable income.
Furthermore, 529 plans have high contribution limits. Many states allow total contributions of up to $500k. Using these plans can be a great estate planning tool for families that have high income and/or a substantial amount of assets.
While contributions are limited to the annual gift tax exclusion limit of $17k per year, one can “superfund” a 529 account by investing up to $85k in a single year. Doing this allows the 529 account to generate compound returns with a higher base of assets. This should result in a larger ending balance when the time comes to pay for your child’s education.
If you use superfunding, you simply have to file tax paperwork that recognizes the superfunded contribution split over five years.
Any contributions above these limits will count towards your lifetime gift tax exemption which is currently $12.9m for single filers or $25.8m for married couples.
529 Rollover to Roth – Beginning in 2024, 529 account balances (up to $35,000) can be converted to a Roth IRA in the name of the 529 beneficiary. This could be a great way to get children started on their path to saving for retirement!
Note: 529 accounts that are owned by grandparents will not affect eligibility for need based financial aid and will not factor into FAFSA calculations.
7. Tax Loss harvesting
Selling securities that are at a loss can be used to offset capital gains. When done properly, it can result in tremendous tax benefits. Simply swapping investments at a loss with other similar securities allows one to realize the loss while still maintaining the same exposure. It is best to couple this with portfolio rebalancing.
At the end of the day, it is not about what you earn, but what you keep!
8. Employer Retirement Plans
Utilizing company retirement plans is one of the best ways to save for retirement and this time of year is a great time to review them. Factoring in the company matching this free money can go a long way.
Review how much money you contributed in 2023. If you are able to, it is worth maxing out your 401(k) or 403(b) accounts. The limits for this year are $22,500 before company matching or $30,000 if you are 50 or older.
Roth versus Traditional IRA – If you think you are in a high income year, then a traditional IRA makes more sense. If you are in a low income year, then contributions to a Roth IRA make more sense.
Review your investments inside your retirement plans – Determine if your investment allocation within your retirement accounts is reflective of your risk tolerance, time horizon and goals. Note: it is important to marry this analysis with all of your other assets that are held outside of your company retirement plans.
Business Owners – Business owners without a company 401(k) plan can easily establish a SEP IRA or SIMPLE IRA plan. You can save up to $66,000 or up to 25% of compensation in these plans.
9. Budget and expense Planning
It’s important for investors to plan their expenses for the future. The following areas should be reviewed:
✓ Cash-flow Planning
Having a detailed plan for what you anticipate spending and how you will pay for those expenditures is key to having the confidence to invest and spend. This is particularly important for retirees.
✓ Sequence of return mitigation
It is important to have adequate cash in your rainy-day account. Typically three to six months is a good rule of thumb for those who are working and retirees are advised to have more.
This will help mitigate the sequence of returns risk. This refers to having to make withdrawals from investment accounts when investment positions are down in value. Mitigating this risk can help lengthen the time your assets will be there for you in the long term.
10. Income Tax Planning
To minimize your overall tax obligation, it is important to have a good handle on what your tax liability is before the end of the tax year. We recommend running a mock tax filing with all of the information that you know at this point in the year. Since most of your income has likely already been earned, you can estimate what your tax liability is for the year.
Once you know this information, you can try to accelerate deductions and defer income to take advantage of lower marginal tax rates.
final thought
While we are all very busy at this time of year, it is worth stopping to take some time to evaluate where you are financially. Making these smart moves now can have a big impact on your future and your chances of success.
At Soaring Capital Management, we go beyond investment products; we provide personalized solutions that consider your unique circumstances and goals.
Reach out to arrange a time to walk through the best year-end planning opportunities for your own portfolio using the link below.
We help you chart the path that leads to your financial success.
Disclosures*
This research note is for illustration and discussion purposes only. It is not intended to be, nor should it be construed or used as, investment, tax, ERISA or legal advice, nor any recommendation of, or an offer to sell, or a solicitation of any offer to buy, an interest in any security. Advisory Services are only offered to clients or prospective clients where Soaring Capital Management, LLC and its representatives are properly licensed or exempt from licensure. Investing involves risk and possible loss of principal capital. No advice may be rendered by Soaring Capital Management, LLC unless a client service agreement is in place.
Pro-forma portfolio illustrations shown are represented gross of advisory fees and expenses and presumes the reinvestment of investment income. Any descriptions involving investment models, statistical analysis, investment process and investment strategies and styles are provided for illustration purposes only. Client investments will vary based on the unique goals, objectives and other factors. No representation or warranty is made that any Soaring Capital Management, LLC investment portfolio, process or investment objectives will or are likely to be achieved or successful or will make any profit or will not sustain losses. Past performance is not indicative of future results.
The information contained herein is as of the date indicated, is not complete, is subject to change, and does not contain all material information, including information relating to risk factors. Any assumptions, assessments, intended targets, statements or the like (collectively, “Statements”) regarding future events or which are forward-looking in nature constitute only subjective views, outlooks, estimations or intentions, are based upon Soaring Capital’s expectations, intentions or beliefs, should not be relied on, are subject to change due to a variety of factors, including fluctuating market conditions and economic factors, and involve inherent risks and uncertainties, both general and specific, many of which cannot be predicted or quantified and are beyond Soaring Capital’s control.
Future evidence and actual results could differ materially from those set forth in, contemplated by, or underlying these Statements. In light of these risks and uncertainties, there can be no assurance and no representation given that these Statements are now or will prove to be accurate or complete in anyway. Soaring Capital undertakes no responsibility or obligation to revise or update such Statements.
Return targets or objectives, if any, are used for measurement or comparison purposes and only as a guideline for prospective investors to evaluate a particular investment program’s investment strategies and accompanying information. Targeted returns reflect subjective determinations by Soaring Capital based on a variety of factors, including, among others, investment strategy, prior performance of similar products (if any), volatility measures, risk tolerance and market conditions. Performance may fluctuate, especially over short periods. Targeted returns should be evaluated over the time period indicated and not over shorter periods. Targeted returns are not intended to be actual performance and should not be relied upon as an indication of actual or future performance.
This research note is not intended for distribution to or use by any person or entity in any jurisdiction or country where such distribution or use would be contrary to local law or regulation.
The post 10 Proven Moves to Boost Your Finances Before 2024 Hits! appeared first on Soaring Capital Management, LLC.
]]>Structured notes offer a unique blend of growth potential and risk mitigation, making them a valuable addition to any investor's portfolio. Whether you are seeking higher income, principal protection, or enhanced returns, structured notes can be tailored to meet your specific financial goals.
The post Elevating Your Investment Strategy with Structured investments appeared first on Soaring Capital Management, LLC.
]]>
Capture 150% upside and only 90% of the downside.
Earn positive returns when the market declines.
These are two examples of how structured notes can help you grow and protect your wealth.
At Soaring Capital Management, we understand that the investment landscape is constantly evolving, and investors like you are looking for opportunities that combine the potential for higher returns with the security of capital preservation. Our mission is to provide you with the knowledge and tools to navigate this dynamic landscape effectively. With structured notes, we can provide defined return outcomes that offer more certainty around returns.
Structured notes, with their unique blend of fixed income components and derivatives, offer a pathway to financial growth while mitigating risks. As we explore various types of structured notes, from income-focused options to growth-enhancing choices, you’ll gain a clear understanding of how these instruments can fit into your investment portfolio.
As you delve into the world of structured notes in this guide, you’ll discover the benefits, risks, and return potential associated with these instruments. Our aim is to empower you with the knowledge to make informed investment decisions and to offer you opportunities that can help your wealth soar to new heights.
Whether you’re a seasoned investor looking to diversify your portfolio or a newcomer seeking financial guidance, Soaring Capital Management is here to assist you on your wealth-building journey.
What are structured Notes?
Structured notes are hybrid securities whose outcomes are tied to the performance of an underlying asset or set of assets including equities, indices, currencies and/or commodities.
For decades, structured notes were only available to institutional and ultra-high-worth investors with minimums of $1 to $10 million per note. Today they are available to all investors with much smaller investment minimums through qualified registered investment advisory firms such as Soaring Capital Management.
Soaring Capital sources commission free notes from a variety of the best, most well capitalized, global issuers such as JP Morgan, Citibank, Bank of America, Goldman Sachs and others. As a fully independent registered advisory company we are not beholden to any one firm’s note offerings. We are free to choose the best note option based on risk, return, pricing and terms and conditions that are best for each client.
In this guide, we define the most common types of structured investments and discuss the benefits and risks of each type.
the structured Note market
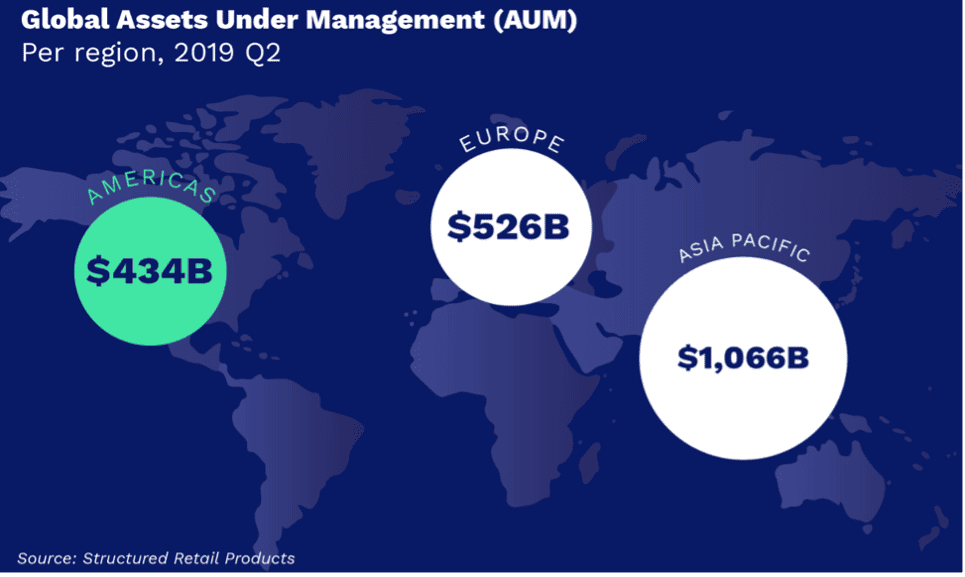
The structured note market is a very large and global market both in terms of the number of notes issued and the dollar amount. There are approximately $2 trillion of notional value of notes outstanding globally and growing. The amount of new issuance in the US alone in 2021 was estimated at over $100 billion. As you can see from the graphic below, much of the issuance has been outside of the US, however the growth of the market in the US is rising at a fast pace.
What are structured Notes?
Structured notes are hybrid securities that are issued by major banks. Underlying the notes are a bond component and a derivative component. The derivative component is a financial security with a value that is derived from an underlying asset such as a stock or an index.
The notes provide a defined outcome that is structured in a way that is optimal for each investor.
All Structured Notes Have Four Simple Parameters:
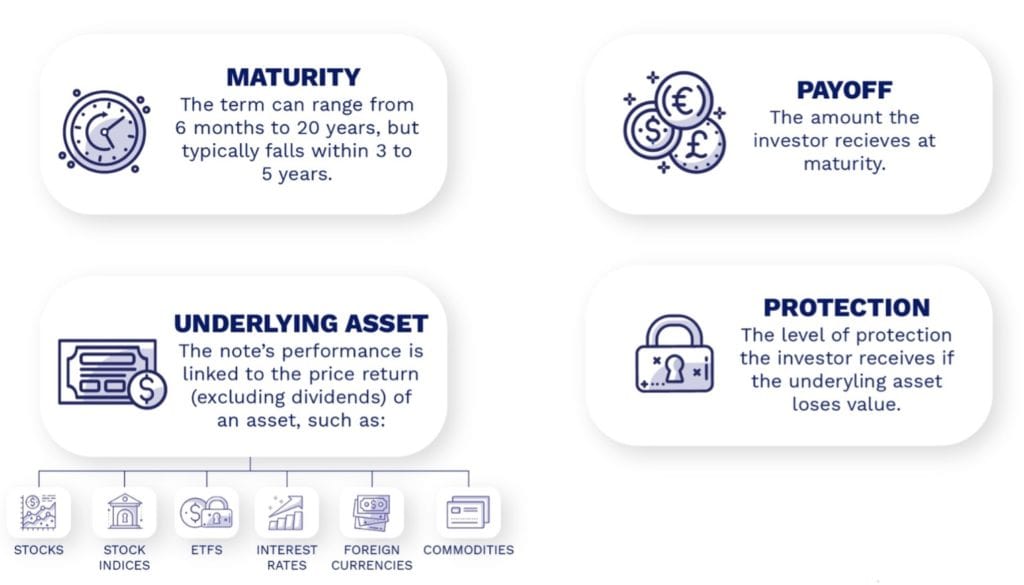
As long as the underlying asset(s) is not down by more than the protection level at maturity, the investor will receive their initial investment back in full plus the income and multiple on the underlying asset(s). Subject to the credit risk of the issuer.
TYPES OF STRUCTURED NOTES
While there are many of types of structured notes, the two main types of notes are:
- INCOME NOTES
- GROWTH NOTES
There is a sub-category of notes that are FDIC Insured and can offer much higher yields vs. traditional Certificate of Deposits (CDs).
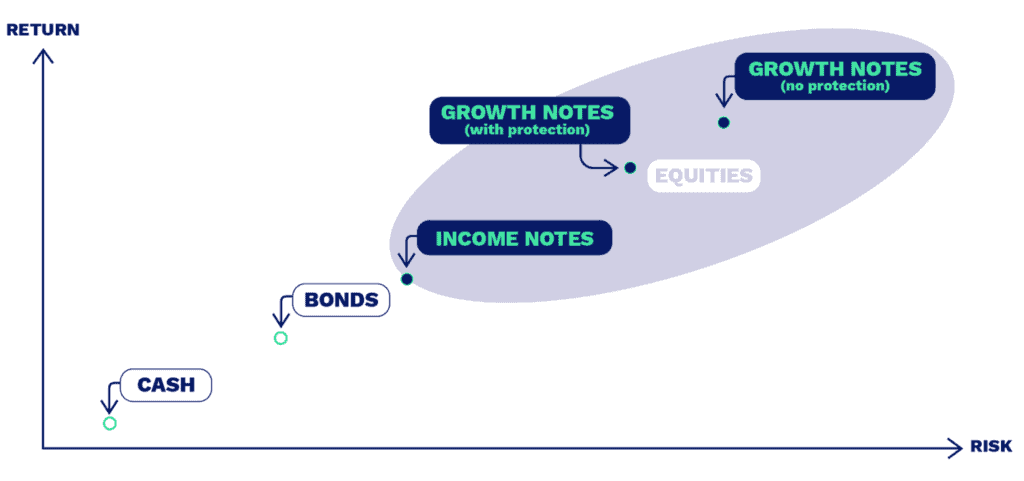
Below is a chart that provides an easy way to think about the risk and return potential in the context of other assets such as cash, bonds and equities. You will see that there are a variety of return and risk profiles. In the case of income notes, they tend to offer significantly higher income with only a slight increase in risk. Likewise, growth notes with protection offer less risk but greater return.
INCOME NOTES
Income notes seek to provide high levels of interest income instead of price appreciation. Investors receive a fixed income payment or coupon over the life of the note provided that the underlying asset(s) is above the coupon protection level.
The level of protection (also called barrier) defines the level/price at which an underlying asset(s) must be in order to receive the coupon payment and full repayment at the maturity.
Income Note Example:


In this example, all income/coupons will be paid at an annualized rate of 10% provided that both the S&P 500 and the Russell 2000 are not down by more than 40%. As to the return of principal, 100% of principal will be returned provided that both the S&P and the Russell 2000 are not down my more than 40%. In other words, in this example, the S&P and Russell could be down 40% and investors will still get all of their money back and all of their interest income.
Soaring Capital generally invests in notes that provide protection barriers in the range of 20-40% for principal and coupon protection. We find that this the sweet spot for capturing income while at the same time providing principal protection or risk mitigation.
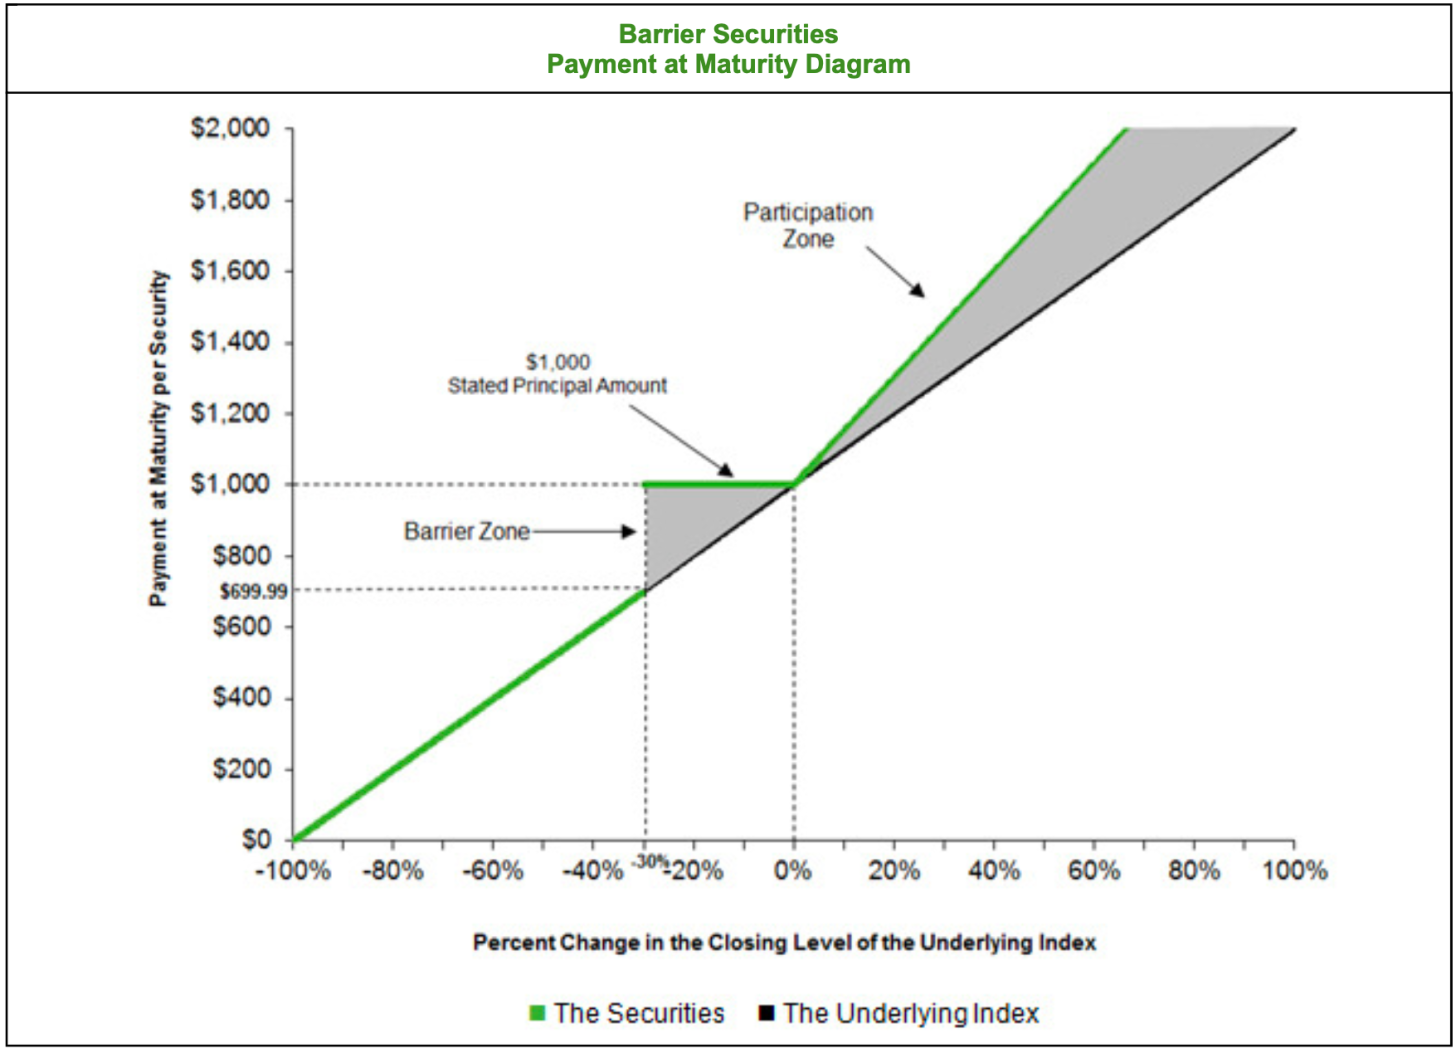
Growth Notes
Investment Returns with Less Risk:
In a growth note, investors receive a percentage of the underlying asset’s price appreciation with a specified amount of principal protection. The amount that the investor receives is known as the participation rate.
Growth notes combine some of the features of a fixed-income security, such as full repayment of principal at maturity (subject to the credit risk of the issuer).
Growth notes generally are designed to return an investor’s initial investment at maturity, while providing the opportunity to participate in the gains on an underlying asset(s).
Depending on the specific offering, growth notes may offer 1 to 1 upside relative to the underlying asset(s) or a multiplier to the upside for accelerated participation relative to the underlying asset(s). Growth notes typically trade off downside protection levels, participation rate and a maximum return cap.
Growth Note Example:


In the above growth note example, the investor will receive the return on the S&P 500 multiplied by 1.17 while at the same time having the comfort of a 30% principal protection barrier.
Examining Various Hypothetical Return Numbers of this Note:
If the index returns 10%, the investor would receive 11.7% or $111,170 per $100,000 invested.
If the index returns 20%, the investor would receive 23.4% or $123,400 per $100,000 invested.
If the index returns -10%, the investor would receive 100% of principal or $100,000 per $100,000 invested.
If the index returns -20%, the investor would receive 100% of principal or $100,000 per $100,000 invested.
If the index returns -30%, the investor would receive 100% of principal invested or $100,000 per $100,000 invested.
If the index returns -40%, the investor would receive -40% of principal invested or $60,000 per $100,000 invested.
Below is Another Way to Visualize the Potential Return:
What Benefits do Growth Notes Provide?
Growth notes offer the returns on a basket of assets with a specific level of downside asset protection. Growth notes allow an investor to remain invested when they are uncertain about the market environment since the protection amount limits or caps the amount of potential losses.
In some cases, growth notes can be structured to produce for positive return even if they underlying assets decline in value.
What are the Downsides of Investing in Structured Notes?
Investors forgo dividends and interest that might be generated from the underlying assets. Investors may also give up a portion of capital appreciation in exchange for full principal protection. Payments on structured notes are subject to the credit risk of the issuer.
Structured notes are not as liquid as other investments. While an investor can sell a note prior to maturity, the pricing received might not be a good as one would like.
Do structured notes make sense for you?
Structured investments can provide innovative ways to invest. They allow investors to target very specific needs or beliefs. This may allow for better targeting of yield and/or return relative to the desired risk and return tolerance.
Whether you seek full repayment of principal at maturity (subject to the credit risk of the issuer), desire additional asset exposure, aim for enhanced returns, or wish to combine these objectives, a structured investment exists (or can likely be created) to address each unique need.
To determine whether these investments are appropriate, consider the following questions:
- What is your investment time horizon?
- Are you comfortable assuming the credit risk of the issuer of the structured investment for all payments on that investment?
- Are you concerned with meeting specific goals?
- Do you have specific income needs?
- Do you have a bullish, bearish, or neutral market outlook?
- Are you comfortable with the risk profile of the underlying assets?
- Are you able to invest capital for longer periods of time?
examples of growth and Income notes*
*Actual notes available as of October 2nd, 2023. Pricing varies and may be better or worse than quoted today. Refer to important disclosures at the end of this article.
Income Note Examples:
1. Ten Percent Annualized Yield Income Note
-18 month term
– Underlying Indices S&P 500 and Russell 2000
– 30% Soft Principal Protection
– 30% Coupon Protection
– Interest Paid Quarterly
2. Eleven Percent Annualized Yield Income Note
– 18 month term
– Underlying Indices: S&P 500, NASDAQ 100, Russell 2000
– 30% Soft Principal Protection
– 30% Coupon/Income Protection
– Interest paid Quarterly
3. Nine and one half Annualized Yield Income Note
24 Month term
– Underlying Indices: S&P 500 and MSCI World Index
– 25% Soft Principal Protection
– 20% Coupon/Income Protection
– Interest paid Quarterly
Growth Note Examples:
1. Eighteen Month Growth Note that offers 15% hard buffer Principal Protection
– Underlying Index S&P 500
– 150% Upside p\Participation with 18.6% cap
- – Full Principal protection down to a market decline of -15%.
2. Two Year Growth Note that offers Full/100% principal protection
– Underlying Index S&P 500
– 100% Upside Participation with a Maximum Gain of 20%
– Full, 100% Principal Protection
3. Hybrid Note with Positive Return in a Down Market
– Note based on S&P 500 and Dow Jones
– 150% participation with 45% max return
– 3 year Note, Non callable for 1 year
– If called at year one investor receives 12% payment
– If the market is down, investor receives the inverse of the decline. For example if the market is down -20% the investor receives a positive +20% return.
– If the market is down more than 20% the investor receives only the decline past 20%. For example, if the market is down 25% the investor is only down 5%.
– If the market is up 25% the investors return is 37.5%
- – If the market is up 50%, the investor receives +45%
Summary
At Soaring Capital Management, we believe that knowledge is the key to successful investing.
In this guide, we’ve explored the world of structured notes, shedding light on these investment instruments that can truly elevate your wealth strategy.
Structured notes offer a unique blend of growth potential and risk mitigation, making them a valuable addition to any investor’s portfolio. Whether you are seeking higher income, principal protection, or enhanced returns, structured notes can be tailored to meet your specific financial goals.
Our mission is to empower you with the knowledge and tools necessary to navigate the ever-evolving landscape of structured investments. We’ve covered the core concepts, different types of structured notes, and their potential benefits and risks. Armed with this understanding, you’re well-equipped to make informed investment decisions that align with your financial aspirations.
At Soaring Capital Management, we go beyond offering investment products; we provide personalized solutions that consider your unique circumstances and goals. We’re ready to partner with you on your financial journey and are here to help you chart the path that leads to your financial success.
Contact us if you are interested in understanding more about structured notes.
Disclosures*
This research note is for illustration and discussion purposes only. It is not intended to be, nor should it be construed or used as, investment, tax, ERISA or legal advice, nor any recommendation of, or an offer to sell, or a solicitation of any offer to buy, an interest in any security. Advisory Services are only offered to clients or prospective clients where Soaring Capital Management, LLC and its representatives are properly licensed or exempt from licensure. Investing involves risk and possible loss of principal capital. No advice may be rendered by Soaring Capital Management, LLC unless a client service agreement is in place.
Pro-forma portfolio illustrations shown are represented gross of advisory fees and expenses and presumes the reinvestment of investment income. Any descriptions involving investment models, statistical analysis, investment process and investment strategies and styles are provided for illustration purposes only. Client investments will vary based on the unique goals, objectives and other factors. No representation or warranty is made that any Soaring Capital Management, LLC investment portfolio, process or investment objectives will or are likely to be achieved or successful or will make any profit or will not sustain losses. Past performance is not indicative of future results.
The information contained herein is as of the date indicated, is not complete, is subject to change, and does not contain all material information, including information relating to risk factors. Any assumptions, assessments, intended targets, statements or the like (collectively, “Statements”) regarding future events or which are forward-looking in nature constitute only subjective views, outlooks, estimations or intentions, are based upon Soaring Capital’s expectations, intentions or beliefs, should not be relied on, are subject to change due to a variety of factors, including fluctuating market conditions and economic factors, and involve inherent risks and uncertainties, both general and specific, many of which cannot be predicted or quantified and are beyond Soaring Capital’s control.
Future evidence and actual results could differ materially from those set forth in, contemplated by, or underlying these Statements. In light of these risks and uncertainties, there can be no assurance and no representation given that these Statements are now or will prove to be accurate or complete in anyway. Soaring Capital undertakes no responsibility or obligation to revise or update such Statements.
Return targets or objectives, if any, are used for measurement or comparison purposes and only as a guideline for prospective investors to evaluate a particular investment program’s investment strategies and accompanying information. Targeted returns reflect subjective determinations by Soaring Capital based on a variety of factors, including, among others, investment strategy, prior performance of similar products (if any), volatility measures, risk tolerance and market conditions. Performance may fluctuate, especially over short periods. Targeted returns should be evaluated over the time period indicated and not over shorter periods. Targeted returns are not intended to be actual performance and should not be relied upon as an indication of actual or future performance.
This research note is not intended for distribution to or use by any person or entity in any jurisdiction or country where such distribution or use would be contrary to local law or regulation.
The post Elevating Your Investment Strategy with Structured investments appeared first on Soaring Capital Management, LLC.
]]>We visit four large Class A buildings in Cincinnati and Houston and speak with leasing teams and building management to find out what is really happening in this sector.
The post Opportunities in Class A Office Real Estate? appeared first on Soaring Capital Management, LLC.
]]>
Would you invest in office real estate now?
Office real estate has been in the financial press a lot and for good reason. Many office real estate investment trusts are trading down 50% or more. There have been a number of high profile office building defaults where the owner couldn’t support the debt payments and turned the building back to the bank.
When markets or sectors are stressed it typically pays to take a hard look to see if there are opportunities.
When thinking about value investing in real estate the person who comes to my mind for inspiration is Sam Zell.
Zell was famously quoted saying “If everyone is going left, look right.”
Zell was one of the greatest investors of our time. He made a fortune buying things that no one wanted to own. Most of what he bought was real estate.
He had nothing to prove to anyone and was always straight in his views, which were often contentious.
“Conventional wisdom is nothing to me but a reference point. In fact, I believe it can be a horribly debilitating concept.”
It often boils down to a bunch of people yelling “Go this way!” And once the crowd gets going, it can get real loud, real fast. We saw it in the stampede of commercial real estate development in the 1970s and 1980s, the dot-com craze of the 1990s, and the subprime mortgage mania of the 2000s.”
He wanted everyone’s opinion, because he saw tremendous value in being a good listener. But then he determined his own path.
Once he formed his opinion, he trusted his perspective enough to act on it. That meant putting his own money behind it. He would stay with his decision even when everyone is telling him he is wrong, which happened a lot.
Office Real Estate – where are we now?
The pandemic clearly has changed office work behaviors, and interest rate increases have made leverage more onerous for heavily indebted building owners. At the same time, the banking sector is less enthusiastic about lending to office real estate.
- Does this mean that all office real estate is doomed to default?
- Are there opportunities to buy assets on the cheap?
- Are there other, less obvious opportunities around these trends?
Looking for opportunities that others are running away from has the potential to produce outsized returns. Additionally, buying assets that are marked down provides a measure of downside protection.
While we will never have perfect information to make any investment decision, I felt it was worth my time to do deeper, on-the-ground due diligence in the office real estate sector.
Houston -Do we Have a Problem?
On May 17th, I boarded a private plane at the Teterboro Airport in New Jersey with five other investors to visit office building assets in Cincinnati and Houston. The buildings we toured were large Class A office buildings located in central or near central business districts. They all had occupancy around 80% and have had good and improving recent leasing experience with long weighted average lease terms.

Class A Versus Class B:
One trend in office real estate is a flight to quality. Lessors are choosing Class A buildings over Class B by a wide margin. The logic is that employers want to provide an incentive for their workers to come to the office. Therefore, they are choosing renovated and highly amenitized space.
A great example of this is the newly completed SL Green One Vanderbilt building in Manhattan. This state-of-the-art building has a 30,000 feet amenity floor that includes a world class restaurant by the Michelin star chef Daniel Boulud, a high-end sushi bar, cafe, shower rooms, conference rooms and a top-drawer fitness center. This building is currently approximately 99% leased and leasing at much higher rates than competing buildings.
Geographic Differences:
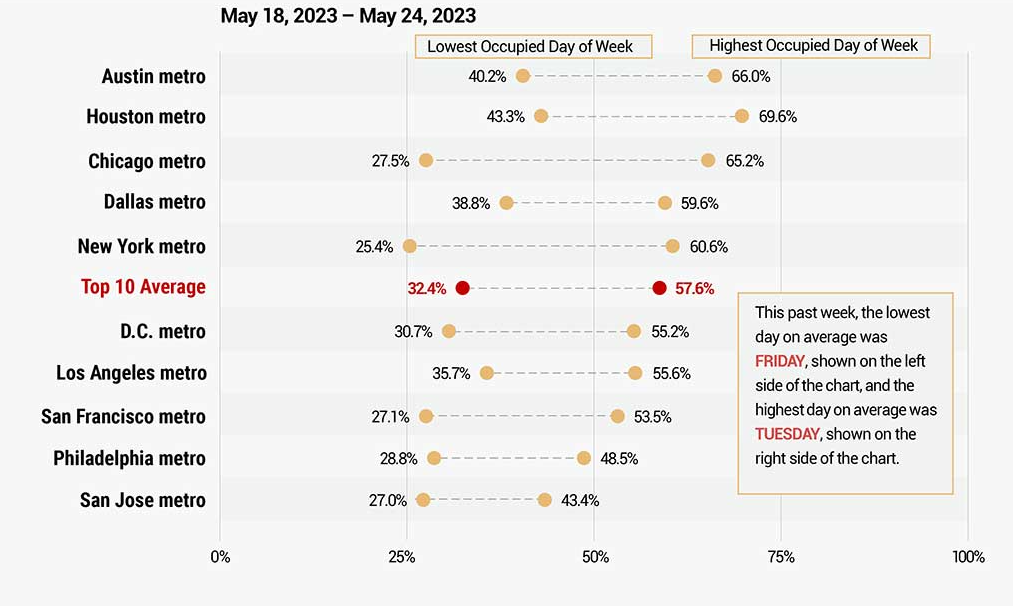
Certain cities are showing a higher proclivity of return to the office. Cities such as Austin and Houston have over 60% return to office while San Francisco, Los Angeles, Chicago, New York City, Atlanta and Boston are well below that. This is likely related to the composition of the type of work in these locations and the mindset of the employers.
Career Advancement for Work from Home vs in Office:
We are beginning to see some companies treat their remote workers differently from their in-office staff. Those who choose to work from home might not be eligible for pay increases or be afforded promotions or advancement opportunities compared with those who work in the office.
Feelings about Remote vs In Office Work:
Seventy-two percent of employees prefer a hybrid remote-office model while at the same time 87% believe the office is essential for collaborating and building relationships with team members. Interestingly, nearly 80% of employers are ready to terminate, cut pay or limit promotions for staff that don’t comply with return-to-office mandates.
More and more companies are firming up their return to the office mandates. Companies such as JP Morgan, Google, Amazon, Starbucks, and Disney have mandates ranging from a full five-days a week to three days- a week in the office requirement. Just this past week Meta tightened its policy and is now requiring employees to be in the office at least three days a week.
Distress Cycle Leading to Bankruptcy
Many Class B office buildings are, or will be, in financial trouble and will likely default.
Many publicly listed office real estate investment trusts (REITs) are over-levered and will not be able to pay their debts. This will be especially acute when the loan interest rates reset at higher levels. Since REITs are required to pay out 90% of earnings this results in minimal cash reserves which can easily result in a liquidity crunch.
In an environment where the value of the real estate has declined, owners are often not able to roll over their debt as the loan-to-value (LTV) of the existing debt is at a higher value than when it was originated. In order for the bank/lender to be comfortable with the new loan they are going to need to add equity to bring down the LTV. The problem is that there are few avenues to raise equity in this sector at the moment. Any equity that is raised will be dilutive which will lead to a dividend cut. This will likely lead to a big decline in the stock price. If they can’t sell equity, they will have to restructure in bankruptcy.
Houston Class A Opportunity

As to the office building for sale in Houston that we toured, this Class A asset is being sold at a 46% discount to the seller’s basis in 2012 and a 27% discount to comparable sales. It is selling at a 9.1% at a cap rate (current net operating income divided by purchase price) and at a 70% discount to replacement cost. It is being purchased with 72% equity and the rest via five-year term debt at a 5.5% capped rate.
The building has 630,000 of leasable square footage. Since October of 2021 it has signed 319,000 SF of new leases which means over half of the building is under relatively new lease terms and rates. The building is currently 83% leased and the tenants have a seven-year weighted average lease term.
Limited partners investing will receive quarterly distributions starting at a 6.5% annual rate. Investors will benefit from accelerated depreciation (which can be used to offset other investor income).
This particular building is being purchased from a group of investors including the largest Canadian pension fund. It is part of a portfolio of real estate that is backed by a loan from Goldman Sachs. Currently they are in default on the loan. Selling this building was identified as a way to help repay the loan while they work to save the rest of their real estate portfolio. This makes for a great discounted value play in the Class A office sector.
The group organizing this purchase plans to hold it for a long time. They forecast putting in minimal capital to upgrade and amenitize the lobby. They plan to re-capitalize building in five to seven years (refinance the 5 year loan) and pay back investors’ original investment. After investors are paid out their original capital, they will enjoy the cash flow that the building produces and still hold their equity.
I would love to hear your thoughts about Class A office real estate and opportunities you are seeing.
Is the better opportunity to wait for more distress?
Can we pick up the pieces after the market declines?
Will it decline more?
Should we short Class B office?
What would Sam Zell do?
Just like Sam, I love hearing everyone’s opinion.
Disclosures*
This research note is for illustration and discussion purposes only. It is not intended to be, nor should it be construed or used as, investment, tax, ERISA or legal advice, nor any recommendation of, or an offer to sell, or a solicitation of any offer to buy, an interest in any security. Advisory Services are only offered to clients or prospective clients where Soaring Capital Management, LLC and its representatives are properly licensed or exempt from licensure. Investing involves risk and possible loss of principal capital. No advice may be rendered by Soaring Capital Management, LLC unless a client service agreement is in place.
Pro-forma portfolio illustrations shown are represented gross of advisory fees and expenses and presumes the reinvestment of investment income. Any descriptions involving investment models, statistical analysis, investment process and investment strategies and styles are provided for illustration purposes only. Client investments will vary based on the unique goals, objectives and other factors. No representation or warranty is made that any Soaring Capital Management, LLC investment portfolio, process or investment objectives will or are likely to be achieved or successful or will make any profit or will not sustain losses. Past performance is not indicative of future results.
The information contained herein is as of the date indicated, is not complete, is subject to change, and does not contain all material information, including information relating to risk factors. Any assumptions, assessments, intended targets, statements or the like (collectively, “Statements”) regarding future events or which are forward-looking in nature constitute only subjective views, outlooks, estimations or intentions, are based upon Soaring Capital’s expectations, intentions or beliefs, should not be relied on, are subject to change due to a variety of factors, including fluctuating market conditions and economic factors, and involve inherent risks and uncertainties, both general and specific, many of which cannot be predicted or quantified and are beyond Soaring Capital’s control.
Future evidence and actual results could differ materially from those set forth in, contemplated by, or underlying these Statements. In light of these risks and uncertainties, there can be no assurance and no representation given that these Statements are now or will prove to be accurate or complete in anyway. Soaring Capital undertakes no responsibility or obligation to revise or update such Statements.
Return targets or objectives, if any, are used for measurement or comparison purposes and only as a guideline for prospective investors to evaluate a particular investment program’s investment strategies and accompanying information. Targeted returns reflect subjective determinations by Soaring Capital based on a variety of factors, including, among others, investment strategy, prior performance of similar products (if any), volatility measures, risk tolerance and market conditions. Performance may fluctuate, especially over short periods. Targeted returns should be evaluated over the time period indicated and not over shorter periods. Targeted returns are not intended to be actual performance and should not be relied upon as an indication of actual or future performance.
This research note is not intended for distribution to or use by any person or entity in any jurisdiction or country where such distribution or use would be contrary to local law or regulation.
The post Opportunities in Class A Office Real Estate? appeared first on Soaring Capital Management, LLC.
]]>The root causes of the failure of Silicon Valley Bank.
The fragility of the banking system. The impact of social media.
How to protect and prosper through this crisis.
The post Important Implications of the Banking Crisis [Report] appeared first on Soaring Capital Management, LLC.
]]>
“Remain calm. All is well”
Kevin Bacon as Chip in Animal House
Some of you might remember a scene in the movie Animal House where actor Kevin Bacon is trying to calm a raucous crowd with the words “Remain calm. All is well.” This didn’t go as planned for him as he was soon flattened by the stampeding crowd.
The situation that is unfolding in the U.S. regional (now global) banking system is scary and unsettling for sure.
It is my view that this crisis will likely be contained and that the majority of banks will NOT be flattened like Kevin Bacon. However, the range of potential outcomes is wide and made wider by a number of factors that I explore in this email.
As investors and stewards of capital, it is critically important to explore and understand this situation at a deep level. Every time there is an event like this, I find it instructive as to what can be gleaned about markets, including the positioning of participants, stress sectors, and areas where we can profit and areas to fade and avoid. These events are like canaries in coal mines that can provide useful signals.
As to the current financial/banking stress, we need to know:
- Are assets safe in banks and brokerage firms?
- How did the banking system get into this situation and how can we avoid it in the future?
- What are the likely paths forward from here?
- How do we protect our portfolios?
- How do we profit from it?
It is best to start with some history on Silicon Valley Bank (SVB) and what is unique about this bank.
Silicon Valley Bank History
How could the 16th largest bank in the U.S. suddenly default? SVB’s default was the largest bank failure since 2008 when Washington Mutual defaulted. SVB equity was trading at $717 per share on October 1, 2021, implying a $42 billion dollar market value and now it is worth ZERO!
Most people went to bed on Thursday night (March 9th) and didn’t question the stability and access to their bank deposits. Today many question that.
How did SVB and some other banks get in this position?
The world is still being impacted by the long-tailed economic effects from the pandemic. These forces directly impacted SVB, Signature and Silvergate banks and potentially other banks.
Venture capital and public equity market sectors such as biotech, software, clean-tech and ecommerce raised billions of dollars during this time. In 2021 alone, there were 613 special purpose acquisition blank check company (SPAC) initial public offerings that raised over $160 billion dollars. There was an equal amount of private capital raised from venture capital limited partners.
The majority of this capital flowed to SVB. See the charts below.
During the pandemic, governments pumped liquidity into the economy at an unprecedented rate. This acted like fire stimulant to certain sectors of the economy and markets. Much of this extra liquidity showed up in the stock market, housing market and some of the most speculative sectors of the start-up/venture economy.
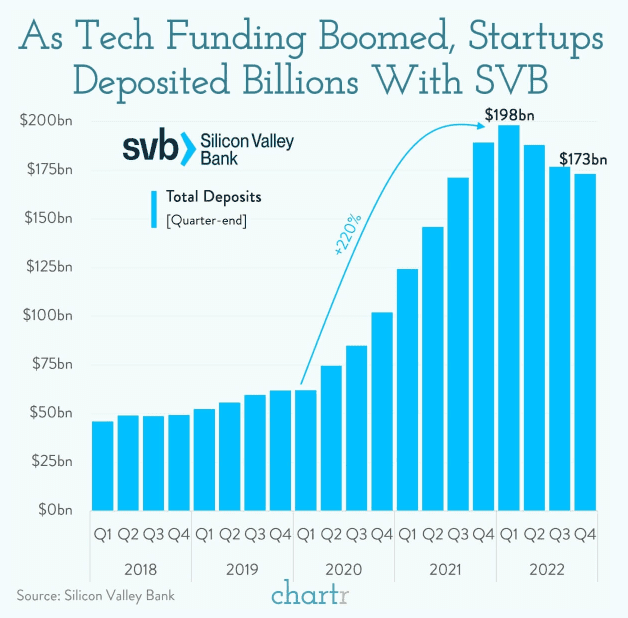
The chart below shows the balance sheet growth of banks from 2019 to the end of 2022.
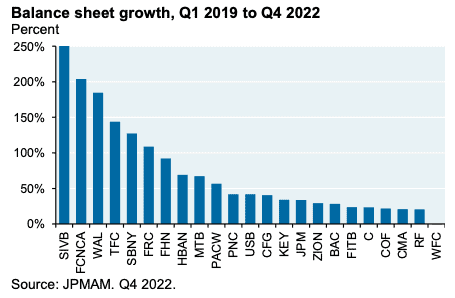
This capital flow became a liability on the balance sheet of the bank as they needed to earn a return on these deposits.
When SVB received these deposits the yield on “safe” Treasury bonds and government backed MBS (mortgage backed securities) was historically very low. The yield on the 10-year treasury ranged from 0.8 to 1.5% at that time.
This yield was kept artificially low by the actions of the Federal Reserve (Fed) and many of the world’s central banks. The Fed believed that inflation was transitory, which allowed them to continue to pump liquidity into the system by buying Treasuries and mortgage backed securities. These actions kept interest rates and yields low.
The net interest margin that SVB was earning was very good at that time. [Net interest margin is the spread that a bank earns from their deposits.] However, as interest rates rose, this margin collapsed. At the same time, they experienced paper losses on their holdings of Treasury and agency mortgage backed securities when rates rose. This left SVB in a precarious position as their adjusted Tier 1 capital ratio did not leave them with any cushion. When the bank realized that it needed to raise capital, it was too late, as no one in their right mind would own their equity at that point. At this point SVB sold their investment holdings at a discount to Goldman Sachs to try to provide liquidity. They realized a $1.8 billion dollar loss on this sale.
The irony is that the deluge of capital that flowed into SVB from venture capital and private equity at a time of historically low rates was more of a curse than a blessing.
One can see graphically in the chart below from JP Morgan how little adjust Tier 1 capital SVB has at the end of the 4th quarter 2022. No other bank is even close to their level of adjusted capital.
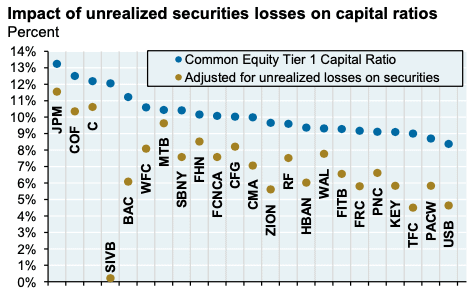
Another complicating factor for SVB was the fact that their main clients (start-ups) stopped adding to their deposits. Previously, these start-ups were able to issue equity as a source of funding. However, as investors reduced their appetite for start-up/venture investing, these companies were unable to raise more capital so they withdrew their cash held at SVB to fund their operations.
Compounding matters was a tweet that Peter Thiel sent to his venture investment companies advising them to pull their money from the bank. This caused a modern day bank run, with much greater digital speed.
Implications
There are a number of interesting aspects to what happened with SVB that are worth exploring.
What does this impute about the overall economy, the banking and finance sectors, banking regulation, inflation, the path of interest rates and future actions by the Federal Reserve? How does social media affect a bank’s stability? How will the response by the government and individuals change behavior? Will banks going forward tighten their lending and investing standards?
There are some of the many questions worth probing.
It is my belief that in general our assets are safe in banks and brokerage firms. The U.S. Government and most other governments are prepared to step in to rescue depositors from losses if held at a failing bank. Even if these deposits at the bank exceed the insured threshold. The FDIC insurance program was established to rescue depositors.
Brokerage firms versus Banks
It is also worth noting that brokerage firms are very different from banks. Brokerage firms such as Charles Schwab, hold custody of over $7 trillion dollars of securities for clients. These securities are held in each client’s name and are segregated from the bank that Charles Schwab manages. Charles Schwab does manage a bank and it has $550 billion in deposits. The bank is managed very conservatively and has a very diverse client base. The Charles Schwab bank is very different from SVB.
The Schwab bank deposits are comprised of the cash sweep assets that are held in Schwab brokerage accounts. Most of Soaring Capital’s client cash balances are not held in a Schwab sweep account at Schwab but are instead held in a money market account which is not related to the Charles Schwab bank. We are able to earn much higher yields on these balances and take very little risk in doing so.
Rapid Rise in Interest Rates
One factor effecting banks is the increase in interest rates and the way that rates have increased. As short term rates have risen, investors have begun to move money out of banks. This acted to destabilize their deposit base.
This money flowed out of cash deposits held at banks and into money market funds and short term Treasury securities. The incentive to do this was to earn much higher returns. For example, one is able to invest in a money market fund and receive 4.5% to 5% interest versus 0.01% on a bank deposit! Which would you prefer?
Social Media and the Impact on Banks
What does social media have to do with banking? Banks are ultimately reliant on depositors’ faith in the bank to operate smoothly. Customer deposits are used to extend long duration loans to businesses or to individuals. The bank only keeps a small portion of the deposits in readily available cash. The amount that they keep is normally adequate under most scenarios. However, the moment depositors en-mass start to lose confidence they demand their money back, which can cause the bank to collapse. This is the cause of many bank failures.
What has changed is the interrelatedness and speed of all of the digital world. Most of us are a tweet, social post or email from news that might scare us causing us to act in a certain way out of fear or greed. I am not implying that the tweet from Peter Thiel caused SVB to collapse but it certainly precipitated it. This is a societal change that needs to be watched.
Start-up Economy
What does the collapse of SVB imply about the health of start-up and venture capital backed companies?
It is my belief that the start-up/venture capital ecosystem is in worse shape than most investors recognize and that it will likely be harder for them in the short to medium term. The main reason for this has to do with the ability of these companies to continue to fund unprofitable businesses. Lenders and investors will exhibit increased caution when purchasing private shares and/or lending to these businesses; this will in turn strain and/or cause some to go out of business.
Banking Sector Broadly
Are all banks in bad shape and nearing a default? I don’t believe that is the case. While the range of outcomes certainly has increased, I don’t believe that we will see a complete collapse of the banking system. If you look at the U.S. Banking System Tier 1 capital ratios, you see a healthy cushion of capital across the system. See the graph below from the FDIC
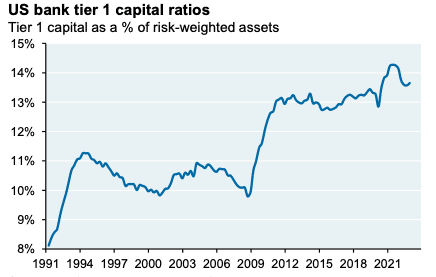
Impact on the Economy
Anytime fear and uncertainty is injected into an economy it hurts confidence and sentiment and will likely cause a mild contraction in spending over the short to medium term. In spite of the government backstop of all deposits, people are still nervous.
Financial Market Impact
If you look at the market action in the U.S. Treasury and gold markets – these moves imply a lot of fear. The moves in these markets are dramatic. You have to look back to 1987 to find moves as violent as these. Volatility across all risk assets has spiked on concerns that we will enter a recession. Crude oil is down significantly and equities sold off.
Course of Monetary Policy
Does the default of SVB effect the course of monetary policy by the Federal Reserve? Will they ease back on the tightening of monetary policy? The banks that defaulted were the consequence of the maneuvers of the Fed. Is this the first of many cracks that will show up as the result of Fed policy actions?
I believe the Fed is determined to squelch inflation in spite of these economic cracks and therefore the likely path of Fed policy is tighter, but perhaps at a slightly slower pace. I think there will be more cracks. While the recent events are de-inflationary, the inflation and employment numbers are still much stronger than the Fed would prefer. Therefore, I am forecasting that they will continue to hike rates.
Regulatory Failure
Was there a regulatory failure around SVB? How will regulation change as a result? Will capital requirements for banks be increased? I believe that there were likely some regulatory/supervisory problems that failed to catch the problems at SVB. Ultimately the government will tighten regulation and undo the Dodd-Frank 2018 lessening of regulation on mid-sized regional banks.
Lessons
There are a number of key investment lessons we can learn (or relearn) as we live through this and other crises. Many of the lessons go back to fundamentals such as diversification, asset liability matching and risk management.
SVB failed to manage a diversified business in both their client base as well as with their investments. Additionally, they allowed for a large mismatch in the duration of their deposits and the duration of their assets. Finally, they failed to risk manage their portfolio properly. Perhaps they lost sight of the fact that there was significant price risk associated with owning government securities.
As someone who worked as the co-head of fixed income strategy at UBS and as a risk manager, I have a keen appreciation for these risk factors. Risk management is key to long term investing success. Investing success is often best accomplished by limiting downside and hitting lots of singles and doubles.
Opportunities and Positioning
I don’t believe that the recent events will be a catalyst to put the economy into a deep recession. However, I do believe that the risks have increased.
Each recent bank that failed did so due to an exaggeration or concentration of risks. While these same risks exist in the banking system at large, they are less impactful for the majority of banks and therefore are likely to be contained. There are banks that have similar aspects as that of SVB. These banks will struggle and could default.
As a result of these forces there will be a continued flight to quality across banks and markets in general.
It is at moments like this when fear grips the market, when lots of money can be made. One has to separate the good from the bad and invest appropriately. I do believe that there are great opportunities in some companies in the banking and brokerage sector. There are companies in the financial services sector that have little to nothing to do with the banking crisis. These companies represent great buying opportunities that we are taking advantage of.
In general, the bank sector is not one that we are particularly bullish on as net interest margin is likely to be slim to negative for some time.
I have generally had a cautious stance on equity and bond exposure and have favored value/discounted sectors. For bond allocations, we have be able to take advantage of market volatility and use tools like structured notes to capture stable, protected income.
We recently invested, for example, in an income note across client portfolios that provides 10.5% annualized interest with 40% downside protection for the coupon and principal. We have also relied on “bond like” assets that give us yield and non-correlation and have employed options strategies that capture income from the market volatility versus being just long equities.
There is plenty to do in the markets today to help us all grow and protect our wealth.
Thank you for the lesson Mr. Kevin Bacon!
I look forward to connecting with you.
Best,
Brian
Disclosures*
This research note is for illustration and discussion purposes only. It is not intended to be, nor should it be construed or used as, investment, tax, ERISA or legal advice, nor any recommendation of, or an offer to sell, or a solicitation of any offer to buy, an interest in any security. Advisory Services are only offered to clients or prospective clients where Soaring Capital Management, LLC and its representatives are properly licensed or exempt from licensure. Investing involves risk and possible loss of principal capital. No advice may be rendered by Soaring Capital Management, LLC unless a client service agreement is in place.
Pro-forma portfolio illustrations shown are represented gross of advisory fees and expenses and presumes the reinvestment of investment income. Any descriptions involving investment models, statistical analysis, investment process and investment strategies and styles are provided for illustration purposes only. Client investments will vary based on the unique goals, objectives and other factors. No representation or warranty is made that any Soaring Capital Management, LLC investment portfolio, process or investment objectives will or are likely to be achieved or successful or will make any profit or will not sustain losses. Past performance is not indicative of future results.
The information contained herein is as of the date indicated, is not complete, is subject to change, and does not contain all material information, including information relating to risk factors. Any assumptions, assessments, intended targets, statements or the like (collectively, “Statements”) regarding future events or which are forward-looking in nature constitute only subjective views, outlooks, estimations or intentions, are based upon Soaring Capital’s expectations, intentions or beliefs, should not be relied on, are subject to change due to a variety of factors, including fluctuating market conditions and economic factors, and involve inherent risks and uncertainties, both general and specific, many of which cannot be predicted or quantified and are beyond Soaring Capital’s control.
Future evidence and actual results could differ materially from those set forth in, contemplated by, or underlying these Statements. In light of these risks and uncertainties, there can be no assurance and no representation given that these Statements are now or will prove to be accurate or complete in anyway. Soaring Capital undertakes no responsibility or obligation to revise or update such Statements.
Return targets or objectives, if any, are used for measurement or comparison purposes and only as a guideline for prospective investors to evaluate a particular investment program’s investment strategies and accompanying information. Targeted returns reflect subjective determinations by Soaring Capital based on a variety of factors, including, among others, investment strategy, prior performance of similar products (if any), volatility measures, risk tolerance and market conditions. Performance may fluctuate, especially over short periods. Targeted returns should be evaluated over the time period indicated and not over shorter periods. Targeted returns are not intended to be actual performance and should not be relied upon as an indication of actual or future performance.
This research note is not intended for distribution to or use by any person or entity in any jurisdiction or country where such distribution or use would be contrary to local law or regulation.
The post Important Implications of the Banking Crisis [Report] appeared first on Soaring Capital Management, LLC.
]]>This research note provides a road map to help investors profit from today's market action.
The post How To Read Today’s Economic Tea Leaves appeared first on Soaring Capital Management, LLC.
]]>
Investing can be equated to reading tea leaves – It is hard to predict the future. This is especially true when trying to determine the macro direction of economies and in turn financial markets.
The easy path is to listen to all of the talking heads and “experts” and to the media spin. However, the media often overly reports on sensational news quotes to grab readers and viewers. This cycle tends to exacerbate the effect of the news as more and more people and outlets pick up the story. This has the effect of getting people whipped up either in extremes of fear or greed.
During my career I have had the pleasure of working with some of the best investors in the world. One who stands out for me is Kerr Neilson. Kerr founded Platinum Asset Management in Sydney, Australia with a $1 billion seed capital from George Soros.
The key investment tenets of Kerr’s is that humans tend to think mostly in the short-term and they tend to extrapolate recent information believing that recent trends will persist in the future.
These biases are good traits for certain aspects of our lives but are not generally desirable as investors. They cause the average investor to buy and sell at the wrong times and to vacillate between fear and greed. It is hard to go against the dominant, and often exaggerated, trends in financial markets and more generally in all aspects of life.
Today there are real concerns in many economies across the global financial markets. However, smart investors learn that economies and markets are two different things. Clearly they are coupled, but markets often disconnect from reality over shorter periods of time. They have tendencies to overshoot on the upsides and downsides.
Let’s unpack the major things happening in the world today and be thoughtful about how to factor them into how to invest now.
This research note covers:
- Inflation – Where are we now and how to profit from it
- The Fed’s Preferred Measure of Inflation and how this Affects our View
- A Deep Dive into how Inflation, Volatility and Sentiment are Affecting Markets
- Targeted Ways to Profit from Today’s Market Action
Inflation – Where are we now and how to profit from it?

The number one financial topic on most people’s minds now is inflation. We all feel it in our everyday lives as our money isn’t going as far as it once did. It is showing up in wages, gas, food, rents, autos, electricity, you name it. Pretty much everything we consume. This is making us nervous, especially for those at lower income levels as inflation acts as a tax by reducing purchasing power.
Inflation is not just an American phenomenon. In fact, it is currently higher in most of the rest of the world. Inflation is higher in other countries largely due to the strength of the dollar and regional energy shortages. The main transfer mechanism for this is via commodities as most major commodities are priced in US Dollars. As the US Dollar has risen, so have commodities in foreign currencies simply due to the strength of the Dollar. For example, the local cost of a gallon of gas in most of Europe is over $7 dollars (equivalent). The same holds for many other commodities.
Inflation is the Federal Reserve’s main enemy now for real and political reasons. Federal Reserve Chairman Jerome Powell for months insisted that inflation was transitory in spite of what Soaring Capital and many experts believed. (Please refer to our March 29th research note on “Profiting from Inflation, Volatility and Uncertainty“.)
Not only has inflation NOT been transitory, it has increased and broadened. The Fed has raised rates 75 basis points three times and has begun other quantitative tightening measures to try to get inflation under control. Yet inflation is still increasing as evidenced by recent economic data. This is not a surprise as monetary measures to control inflation work with a long lag time.
Inflation Persistence
If Chair Powell misread the persistence of inflation in 2021, do we think that he will correctly read it now and therefore take the correct actions?
Based on his public comments, he is determined to expunge the system of inflation and bring it back down to 2%. He has shown resolve in his comments and actions and appears not to worry about the economic consequences that might result from his actions to reduce inflation. If fact, he has publicly stated that he is willing to accept moderate increases in unemployment to quell inflation.
As a result of this information, we believe that there is a high probability of a policy error on behalf of the Fed. While we do strongly believe that the Fed needs to reduce liquidity, we believe that they should proceed at a slower pace.
If the Fed continues to tighten monetary policy rapidly, the question becomes how much will it damage the economy?
Managing monetary policy to engineer a specific economic outcome is much like steering a large ocean vessel. When you make a change of course, it can take a long time for that course change to become evident. It is difficult to navigate a straight course.
An Inflation Deeper Dive
The measures of inflation that the Fed is focusing on are generally driven by what happened in the past (lagging indicators). I am referring to measures of job openings, unemployment and wages. These indicators typically follow monetary actions with a lag of six months or more. Therefore, we are not likely to see the effect of the recent Federal Reserve tightening for many more months in the official measures of inflation.
Other indicators, however, have reacted quickly and are indicating an economy that is softening. A few metrics that we look at are: housing, rents, new building permits, used car prices, commodity prices, interest rates, leverage loan underwriting volume, corporate and high yield bond risk premiums. All these indicate softness.
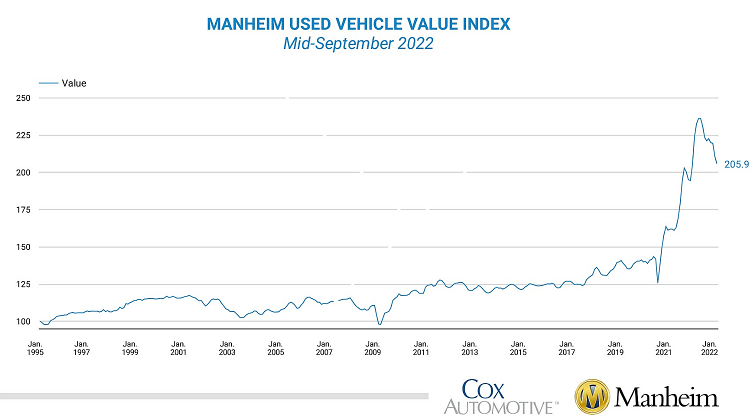
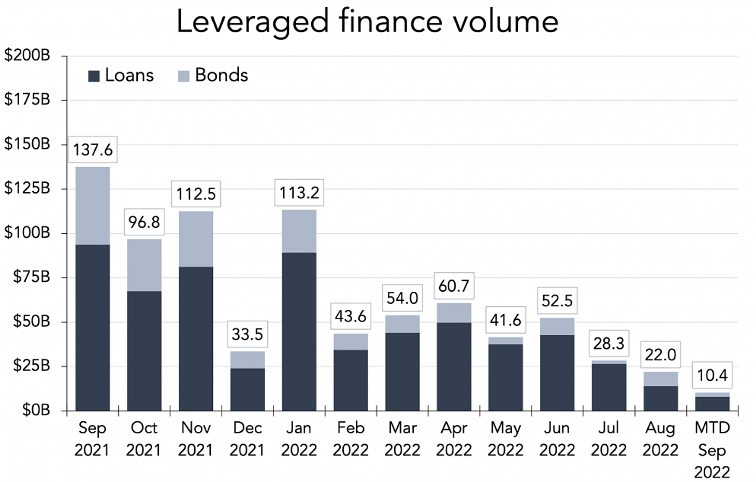
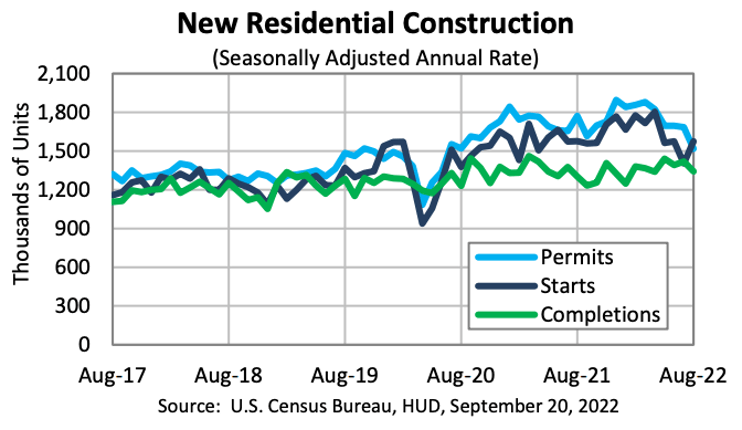
The Fed’s Preferred Measure of Inflation
The Fed’s preferred measure of inflation is the Personal Consumption Expenditure Price Index Inflation, otherwise known as the PCE Deflator. This metric continues to show persistent and rising inflation.
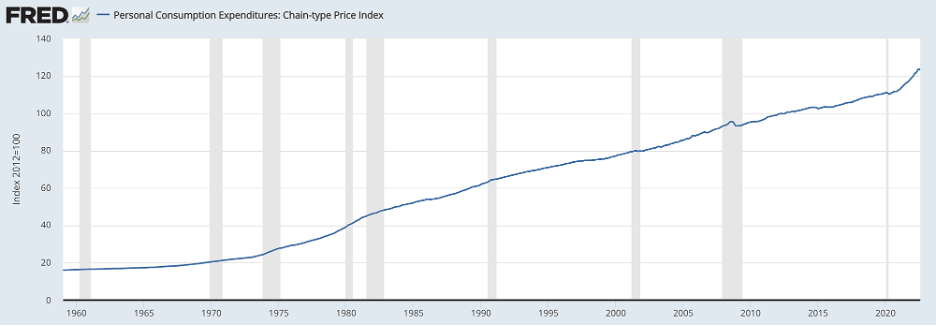
One important metric not factored into the Fed calculus is sentiment. Besides the actual removal of liquidity from the monetary system, the actions of the Fed work through moral suasion. At the margin, the average individual, CEO, manager, or business owner will behave more cautiously as they fear we are heading into a recession. These small individual behaviors can lead to a large impact on overall economic activity.
Additionally, interest rates, as evidenced by Treasury bond yields, moved to much higher yields. Today short term Treasury bonds can be purchased at yields of 4% to 4.5%. These rates are much higher than the actual stated Federal Reserve Fed Funds target rate. Higher levels of interest rates affect all asset values. Higher rates lead to a contraction of growth.
The Initial Public Offering and Leverage Finance Markets
The IPO market has been all but dead with only 32 IPOs year-to-date. This represents a decline of 88%!
Likewise, leveraged loans and high yield issuance have essentially dried up with issuance down and yields up. This is causing leveraged companies to find it harder to refinance their debt and buyout firms are finding it hard to finance buyouts.
The investment banks that supported the April 2022, $15b leveraged buyout of Citrix Systems by Vista Equity Partners and Elliott Investment Management found it hard to find buyers for the Citrix loans. They were forced to take millions of dollars of losses on these loans to get them off their balance sheets.
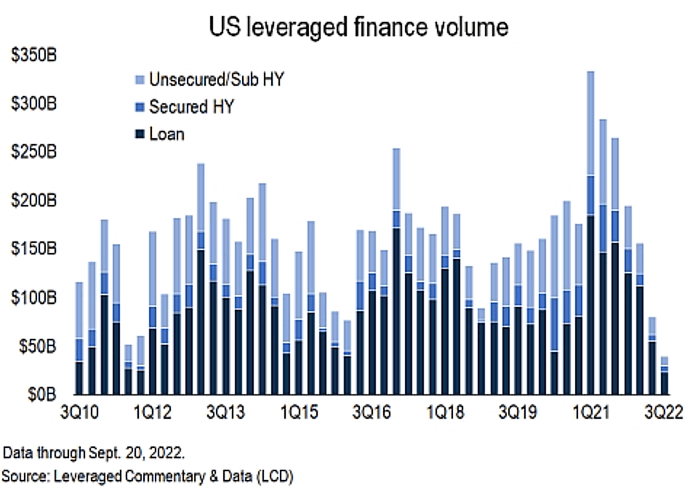
Inflation and Corporate Earnings
Inflation not only impacts personal consumption, it affects corporate earnings. Companies are facing increased wage and input costs. Some companies can pass these increased costs along to their customers, others can’t and have to accept smaller profit margins.
Costco is a good example of this as they increased sales by 16% (10% excluding gasoline sales) but witnessed a 1% reduction in profit margin. They had to accept 8% input inflation during the third quarter. That said, Costco forecasts inflation reductions and higher profit margins going forward. They are seeing reductions in fuel, transportation, beef, cargo containers and others. How many other companies are in a similar situation?
Investor Sentiment
Investor sentiment as measured by The American Association of Individual Investors (“AAII”) is currently measuring at one of the lowest levels in their 35 year survey history. Over 56% of investors are bearish as of October 19th. This represents a slight improvement from the middle of September when it hit 60%. The other time it reached a level lower than today was in March 2009. Levels of extreme negative sentiment are typically a good contra-indicator, meaning it is a good time to invest.
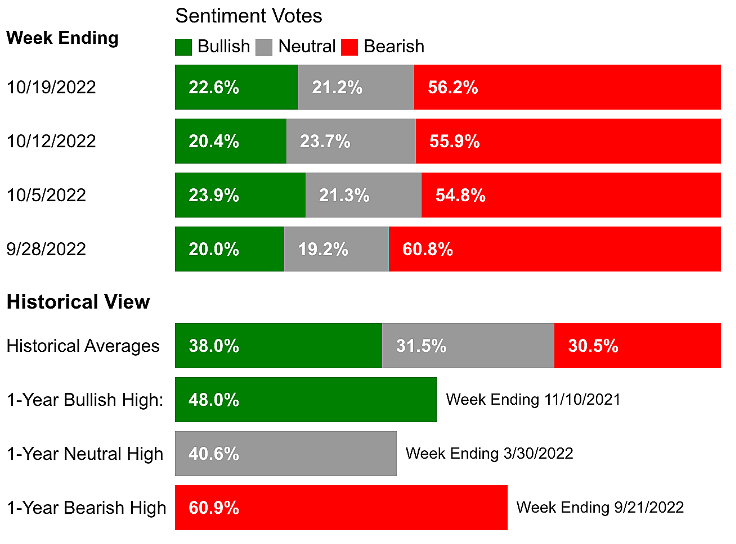
targeted WAYS TO PROFIT IN TODAY’S MARKET
High inflation, high commodity prices, bad investor sentiment – what does all of this mean for investors? Clearly this has been a bad environment to be a long-positioned investor. Not only have equities sold off, but bonds have declined in value by a similar amount as well. Additionally, this is not just a US phenomenon, as it has affected nearly every global equity and bond market.
Our view at Soaring Capital is that the Federal Reserve will back off from rapid interest rate increases once they see more signs of economic softness. We believe they will still increase rates, but will do so at a slower pace. We also believe that the Fed will be willing to accept higher inflation than the 2% that they have guided to.
As Paul Tudor Jones recently commented, “Inflation is a bit like toothpaste. Once you get it out, it’s hard to get it back in.” The theory being that some forms of inflation will prove to be very sticky and are unlikely to decline much in the absence of a deep recession. In particular, wage and owners-equivalent rent inflation are unlikely to move down in the near term.
Additionally, we don’t believe some components of inflation are being driven by monetary forces, and therefore they are unlikely to be reduced by monetary forces. I am referring to certain commodities like energy where there are structural issues with supply.
Looking around the globe at each geographic region, we see that there is coordinated economic slowing. While most of the world’s economies are slowing they are still showing expansion, albeit at a slower rate. Some countries like Australia, Japan, Korea, India, Brazil and Mexico are holding up much better than the UK/Eurozone and China.
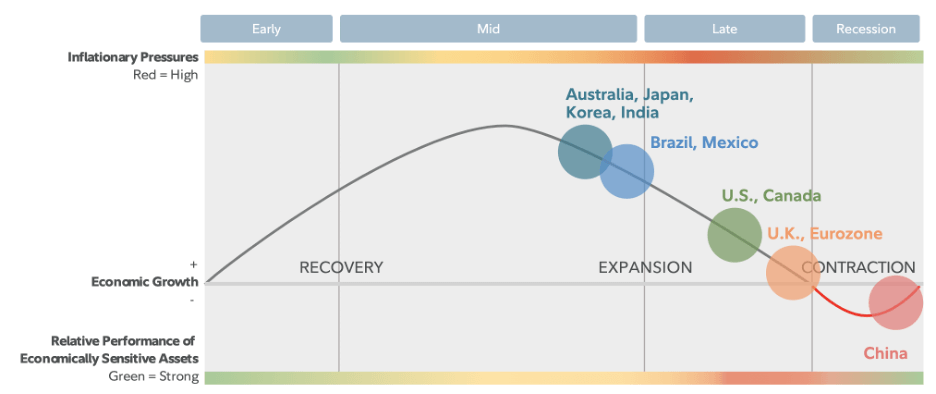
Below is an excellent visualization of global growth rates for 2022 from the International Monetary Fund (IMF).
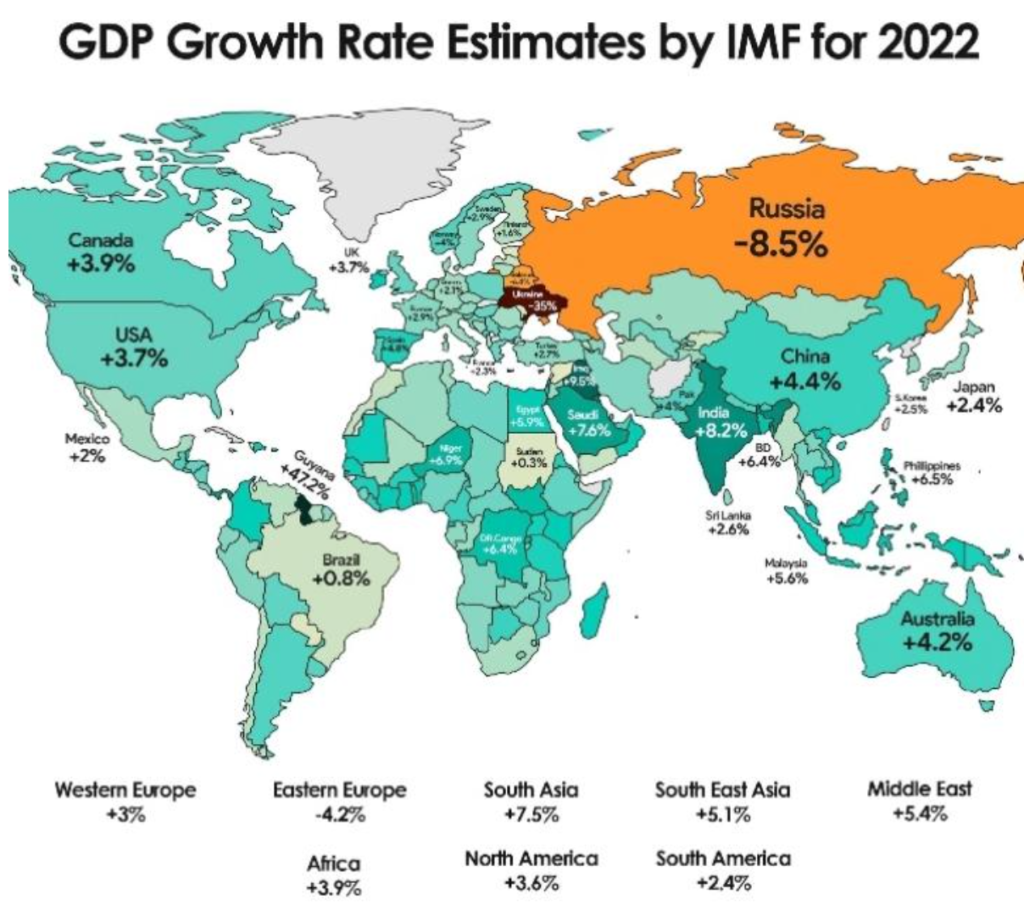
EQUITY SECTORS AND MARKET CYCLES
When looking at equity sector performance, the chart below provides a good guideline for the performance of each sector during various points in the economic cycle. This gives us some ideas as to where we should be allocating relative to where we believe we are in the economic cycle.
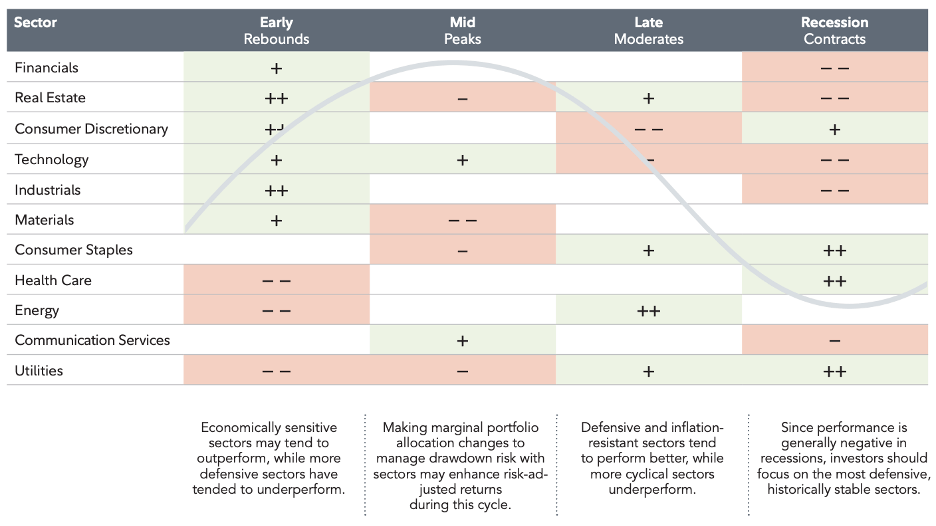
ENERGY
We have been fortunate to have allocated a meaningful amount of capital to the energy sector at the beginning of the year. The energy sector has been one of the few winners this year and it has accounted for our significant out-performance relative to the benchmark for our clients.
While this sector is not loved by ESG enthusiasts, we continue to believe energy is still a good place to allocate. In spite of everyone’s desire for clean energy (including our own), we will likely need fossil fuels for a long time still.
We have identified many outstanding energy related investments that we believe are reasonably valued and have years worth of growth ahead of them. These include exploration and production, oil service and pipeline companies.
One of these investments is producing 9% yield and trading at 7 times forward price to earnings. We are also invested in a pipeline fund. This fund is structured as a closed-end fund and is trading at a 13% discount to its asset value and providing investors with 8% yields.
From a macro perspective, if we go into a deep recession, energy prices will likely trade down. However, the supply and demand balance will likely keep a high floor on price as the world does not have any meaningful excess supply. See chart below on current global oil inventories.
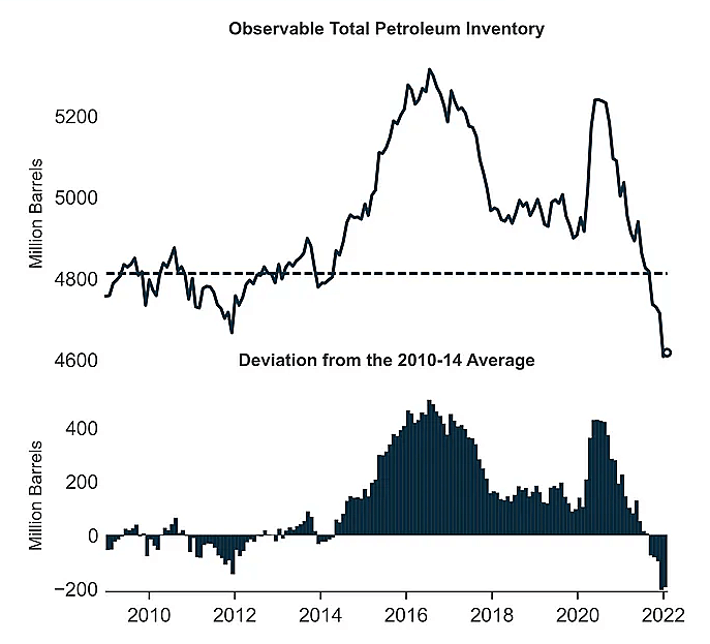
Volatility
In our March research note we discussed having an investment allocation that profits from volatility (so called “long vol”). We continue to believe that having this allocation makes sense now. The investment funds that we identified have profited from this market volatility and have produced between +25% and +35% net return year-to-date through September. Below are some other ideas that we implemented to capture return from elevated volatility.
1) Option Premium Capture:
When market volatility increases, option prices increase (all else being equal). This means that there are more opportunities to make money in the options markets. We have identified two investments that utilize this strategy. In this environment, these strategies are making outsized yield. One such fund is providing exposure to blue chip US equities while also providing clients with 11% annualized dividend distributions.
2) Structure Notes:
As volatility and interest rates increase, the pricing for structured notes also improves. Structured notes are contracts with banks or brokerage firms that provide a defined return or yield. Structured notes are a global, multi-trillion dollar assets under management business. Historically, they were only available to institutional investors.
Today, Soaring Capital has the capabilities to include structured notes in client portfolios and can structure them customized for each client.
There are two general types of notes: Income Notes and Growth Notes:
Income Note Example: Clients earn approximately 12% annualized yield on a 24 month note based on the S&P 500 index. The client will receive a 3% interest payment at the end of each quarter for which the S&P is not down by more than 30%. Additionally the client receives 100% of the investment principal back provided S&P does not decline more than 40% at maturity. Therefore at maturity, in 2 years, if the S&P is down 19% the investor receives 100% of investment back plus interest payments each quarter.
Growth Note Example: Clients earn 1.5 times the return of the lowest performer between the Dow Jones Industrial Index and the S&P 500 over a 24 month period. Additionally, the client receives 15% soft principal protection. If the S&P rises by 25% in two years, the note would provide a return of 37.5%.
Soaring Capital accesses these notes for clients on a zero commission basis, which increases the return relative to purchasing them via a broker or bank.
Short Duration Opportunities
As yields have increased, we now can earn much higher interest than in the recent past. For investors looking to deploy cash in a very conservative manner, we can build a portfolio that can yield 4 to 5% while maintaining a duration of around 2 years or less. Municipal bonds can now be purchased to earn approximately 6% taxable equivalent yield for 2 year bonds (for investors residing in high tax states).
Summary
Equity markets don’t always go up, and large moves to the downside do and can happen. In many ways, this market action represents a deflation of valuation excess as the majority of the market decline can be attributed to multiple compression and not earnings decline. Essentially, investors are choosing to pay less for assets. While we did see a slight decline in S&P 500 earnings growth, revenue growth has remained relatively strong and positive.
The actions by the Federal Reserve, the war in Ukraine and the lingering effects of COVID have conspired to make investors reassess their ways. This has created big losers and some winners. It has also provided great entry points for investors to buy quality companies at significant discounts.
The power of allocating when markets are on sale can be large and can compound for many years.
Examining some of my long term personal investments, simply from a yield perspective relative to purchase price, they have become massive compounders of wealth. One of these investments is now yielding over 60% per year based on my original cost basis!
This is possible for you as well if done correctly. The trick to investing is to properly read the tea leaves and not be shaken out as a weak hand. This is hard to do, but not impossible.
We look forward to connecting with you.
Best,
Brian
Disclosures*
This research note is for illustration and discussion purposes only. It is not intended to be, nor should it be construed or used as, investment, tax, ERISA or legal advice, nor any recommendation of, or an offer to sell, or a solicitation of any offer to buy, an interest in any security. Advisory Services are only offered to clients or prospective clients where Soaring Capital Management, LLC and its representatives are properly licensed or exempt from licensure. Investing involves risk and possible loss of principal capital. No advice may be rendered by Soaring Capital Management, LLC unless a client service agreement is in place.
Pro-forma portfolio illustrations shown are represented gross of advisory fees and expenses and presumes the reinvestment of investment income. Any descriptions involving investment models, statistical analysis, investment process and investment strategies and styles are provided for illustration purposes only. Client investments will vary based on the unique goals, objectives and other factors. No representation or warranty is made that any Soaring Capital Management, LLC investment portfolio, process or investment objectives will or are likely to be achieved or successful or will make any profit or will not sustain losses. Past performance is not indicative of future results.
The information contained herein is as of the date indicated, is not complete, is subject to change, and does not contain all material information, including information relating to risk factors. Any assumptions, assessments, intended targets, statements or the like (collectively, “Statements”) regarding future events or which are forward-looking in nature constitute only subjective views, outlooks, estimations or intentions, are based upon Soaring Capital’s expectations, intentions or beliefs, should not be relied on, are subject to change due to a variety of factors, including fluctuating market conditions and economic factors, and involve inherent risks and uncertainties, both general and specific, many of which cannot be predicted or quantified and are beyond Soaring Capital’s control. Future evidence and actual results could differ materially from those set forth in, contemplated by, or underlying these Statements. In light of these risks and uncertainties, there can be no assurance and no representation given that these Statements are now or will prove to be accurate or complete in anyway. Soaring Capital undertakes no responsibility or obligation to revise or update such Statements.
Return targets or objectives, if any, are used for measurement or comparison purposes and only as a guideline for prospective investors to evaluate a particular investment program’s investment strategies and accompanying information. Targeted returns reflect subjective determinations by Soaring Capital based on a variety of factors, including, among others, investment strategy, prior performance of similar products (if any), volatility measures, risk tolerance and market conditions. Performance may fluctuate, especially over short periods. Targeted returns should be evaluated over the time period indicated and not over shorter periods. Targeted returns are not intended to be actual performance and should not be relied upon as an indication of actual or future performance.
This research note is not intended for distribution to or use by any person or entity in any jurisdiction or country where such distribution or use would be contrary to local law or regulation.
The post How To Read Today’s Economic Tea Leaves appeared first on Soaring Capital Management, LLC.
]]>The post How to Make Money in a Down Market appeared first on Soaring Capital Management, LLC.
]]>
I made $8,385 from April 21st through June 17th! During this same time, the NASDAQ was down ~19%, bonds were down ~7% and many individual stocks were down 50-80%.
HOW DID I DO THIS YOU MIGHT ASK?
Essentially it comes down to being contrarian and to invest with facts over emotion.
While most were running from risk, I made calculated investments with limited downside. When markets sell off violently, people tend to lose sight of fundamentals and simply sell as they can’t stomach the pain of losing money or they are forced out of positions because of leverage.
Typically, this results in certain companies being sold indiscriminately, causing them to trade at or below fair value. This shows up most clearly in the options markets where one can see where the pricing of risk is estimated to be in the future.
All told, I made this money over the last two months by using the options markets to pay me to own companies that I would like to own at certain prices way below their current value. While we can estimate fair value, it is hard to know where the price will ultimately settle since, at the end of the day, the price of most things is simply determined by what price two people are willing to buy and sell. Therefore, we buy options that put a floor under how much risk we take, which limits our potential downside.
Since I worked for a multi-billion-dollar hedge fund a couple of years ago that occasionally used futures, currency forwards and options, I needed to obtain the FINRA Series 3 Futures and Option license. At the time, I was dreading taking the time and energy to take this test as I didn’t envision making use of that knowledge. I ended up receiving a score of 98% on the exam. Perhaps I studied too much? Regardless, the knowledge that I gained has proven to be incredibly useful to both hedge and profit for me and my clients.
While the markets have certainly been unsettled of late, to me it feels like a normal, but rapid, flushing of excess and a normal response to the world’s central banks reducing liquidity in the midst of war, tight commodity supplies and elevated inflation. I typically find during times like these are when there are great opportunities.
Brian F. Moss, CFA
The market action has been striking, particularly in the high-tech investment universe. Many names in Cathie Wood’s ARK Invest, ARK Innovation fund are down 50 to 90%! It is painful to watch these stocks decline so much so fast. I was investing during the dot-com blowup of 2001 and was caught in some of the mania but mostly was an observer and astute learner of what happened.

As a person who studied economics, I try to assimilate as much information as possible and think of all the possible angles. I try to watch for signs of the boiling frog. That age old tale of a frog sitting in a slowly warming pot of water. The frog will not jump out of the water as it heats and ultimately it will succumb to its death. However, if you throw a frog into a pot of boiling water it will instantly jump out.
Many investors exhibit characteristics of this whereby when they rise or fall slowly, they become complacent to the risks and to the stretched valuations. They tend to overstay on the way up and stay out on the way down. Our job is to attempt to get ahead of these moves to protect and profit for our clients.

As a former colleague once told me: “There is always a bull market somewhere.” The trick is to think differently, using orthogonal thinking and to use all of the tools available to capture the investment ideas in the safest, most risk-controlled manner.
All four of these investments I mentioned earlier closed with a significant profit resulting in a total gain of 4.8% on capital at risk which equates to a 24% out-performance versus the NASDAQ Index.
If you are interested in the details of these investments and more generally how we plan and position our clients for success, please reach out to schedule some time on our calendar.
Sincerely,
Brian
Disclosures*
This research note/blog post is for illustration and discussion purposes only. It is not intended to be, nor should it be construed or used as, investment, tax, ERISA or legal advice, nor any recommendation of, or an offer to sell, or a solicitation of any offer to buy, an interest in any security. Advisory Services are only offered to clients or prospective clients where Soaring Capital Management, LLC and its representatives are properly licensed or exempt from licensure. Investing involves risk and possible loss of principal capital. No advice may be rendered by Soaring Capital Management, LLC unless a client service agreement is in place.
Pro-forma portfolio illustrations shown are represented gross of advisory fees and expenses and presumes the reinvestment of investment income. Any descriptions involving investment models, statistical analysis, investment process and investment strategies and styles are provided for illustration purposes only. Client investments will vary based on the unique goals, objectives and other factors. No representation or warranty is made that any Soaring Capital Management, LLC investment portfolio, process or investment objectives will or are likely to be achieved or successful or will make any profit or will not sustain losses. Past performance is not indicative of future results.
The information contained herein is as of the date indicated, is not complete, is subject to change, and does not contain all material information, including information relating to risk factors. Any assumptions, assessments, intended targets, statements or the like (collectively, “Statements”) regarding future events or which are forward-looking in nature constitute only subjective views, outlooks, estimations or intentions, are based upon Soaring Capital’s expectations, intentions or beliefs, should not be relied on, are subject to change due to a variety of factors, including fluctuating market conditions and economic factors, and involve inherent risks and uncertainties, both general and specific, many of which cannot be predicted or quantified and are beyond Soaring Capital’s control. Future evidence and actual results could differ materially from those set forth in, contemplated by, or underlying these Statements. In light of these risks and uncertainties, there can be no assurance and no representation given that these Statements are now or will prove to be accurate or complete in any way. Soaring Capital undertakes no responsibility or obligation to revise or update such Statements.
Return targets or objectives, if any, are used for measurement or comparison purposes and only as a guideline for prospective investors to evaluate a particular investment program’s investment strategies and accompanying information. Targeted returns reflect subjective determinations by Soaring Capital based on a variety of factors, including, among others, investment strategy, prior performance of similar products (if any), volatility measures, risk tolerance and market conditions. Performance may fluctuate, especially over short periods. Targeted returns should be evaluated over the time period indicated and not over shorter periods. Targeted returns are not intended to be actual performance and should not be relied upon as an indication of actual or future performance.
This research note is not intended for distribution to or use by any person or entity in any jurisdiction or country where such distribution or use would be contrary to local law or regulation.
The post How to Make Money in a Down Market appeared first on Soaring Capital Management, LLC.
]]>The post Profiting from Inflation, Volatility and Uncertainty appeared first on Soaring Capital Management, LLC.
]]>
The other day I went to my local bakery and asked for two croissants.
“Coming right up sir!” said the baker.
At this point I was salivating as these croissants looked and smelled delicious. When it was my turn to pay and woman said, “That’ll be $16.50” in a matter of fact tone.
“I only asked for two” I said.
“Yes, that’s right $16.50. Cash or credit.”
We all know that there is significant inflation now. We all feel it in our everyday lives with almost every purchase – including my $16 croissants! It is being felt more directly now that gas prices have spiked up significantly since the war in Ukraine.
The question financial advisors and investors need to ask is how to invest in the face of inflation, risk and war uncertainty?
What are the implications for the movement of interest rates, equity valuations, equity sector valuations, valuations of different countries’ equity markets, foreign currencies, etc.?
This article will unpack my thinking on these issues and at the end of the article offer timely strategies on how to manage and profit through this period.
This article covers:
- Inflation – How did we get here?
- Energy Supply and Demand
- Commodities and War
- Commodities and Net-Zero
- Equities and Equity Sectors in a Rising Rate Environment
- Real Estate Sectors and Inflation
- How to Position Portfolios Now
Inflation – How did we get here?
During the pandemic, the Federal Reserve Bank and the Treasury Department injected record amounts of stimulus into the financial system, increasing the balance sheet to nearly $9 trillion dollars as of today. At the same time, the Fed changed their formula for when they would respond to changes in inflation. Historically, the Fed would attempt to get ahead of inflation by adjusting in advance inflation. Today the Fed is choosing to let inflation run higher than normal.
Their thinking was that inflation would be transitory based on the idea that it was principally caused by supply chain disruptions and the post COVID economic reopening boom. Initially that was the case as inflation was somewhat limited to goods, however we now see inflation expanding from goods to services to wages and does not appear to be transitory.
Consumer and producer prices recently printed increases of ~8% each. Even if you strip out the volatile food and energy components, the numbers are still high by historical standards.
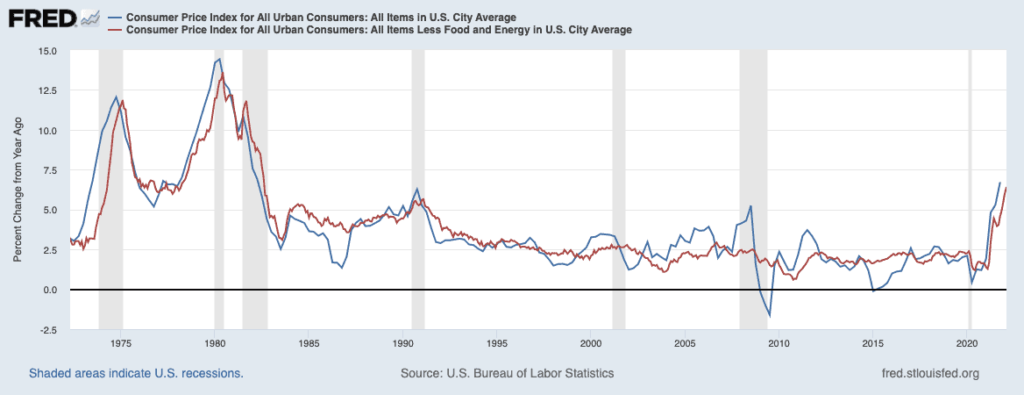
The Fed learned from the years 2009 through 2020 that they could run more stimulus through the economy and not have it show up as inflation even with an economy running at full employment.
The Fed was willing to trade off economic support for higher inflation. This created a situation where we had interest rates at historic lows and a robust economy. This resulted in deeply negative real rates of interest, i.e. interest rates below the rate of inflation. This encourages/encouraged speculation.
We can observe the effects low rates on the valuations of growth equities, crypto currencies, SPACs and meme stocks to name a few. One was incentivized to take risk as there was no interest to be earned in bank deposits or bonds.
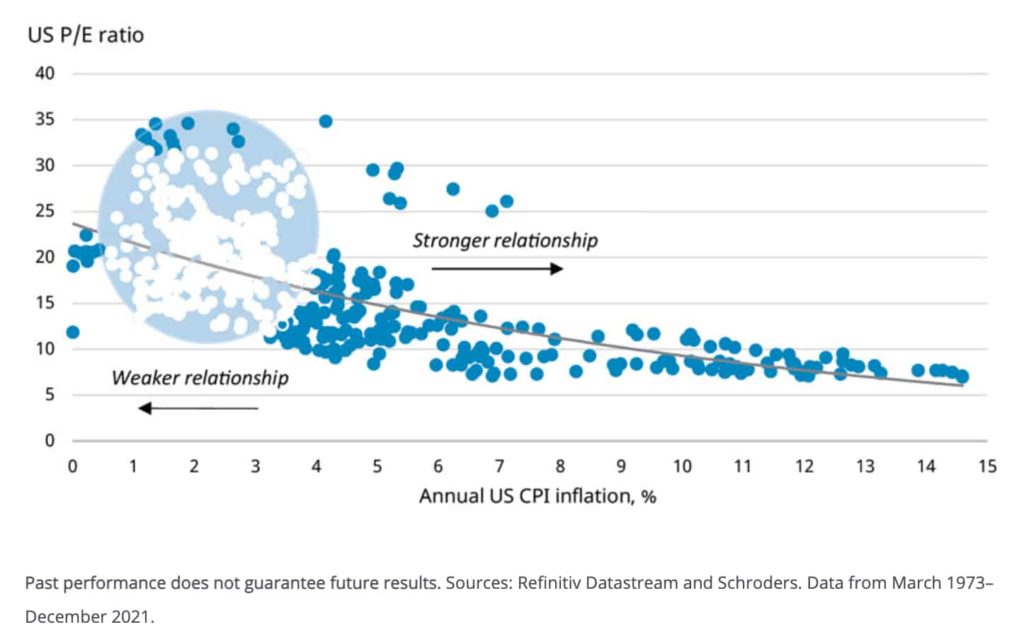
One of my favorite examples of the recent effect of low rate and Fed liquidity in the market is a company called Joby Aviation. Joby is developing a vertical take-off plane taxi. “Tesla meets Uber in the air” according to their own description. I like the idea and would love to own one when they are in production. What I wouldn’t do is buy the company’s stock which went public a $6 billion-dollar valuation.
They have yet to produce a single unit and will not have one until 2024 at the earliest. The company is backed by some big names such as Reid Hoffman and Mark Pincus. Big names will only get you so far. The stock is down 70% from its high and it probably will be cut in half again from here as the company currently has ZERO revenue and is still valued at nearly $3 billion!
What worked?
I added allocations to oil, commodities and gold in client portfolios about a year ago. This was based on the following ideas:
● Oil was under-invested and would be in tight supply
● Commodities would be a good inflation hedge and in high demand in a net zero carbon emissions world; and
● Gold is a good volatility/inflation hedge
This worked out well so far for clients with energy investments up over 30%, commodities up over 20% and gold up over 8% year to date.
The question is where do we go from here?
Aside from the geopolitical changes that the war in Ukraine implies for World order, the war has bolstered the concerns about supply of energy, commodities and the nationalization of production of goods generally.
Let’s try to explore these one at a time:
Energy
The global supply of oil was already tight due to the lack of investment in exploration and production, environmental concerns and net zero government policies. Spending by super major oil companies (Exxon, Shell, BP, etc.) declined by 50% since 2015 according to IEA (International Energy Agency) while demand for energy increased.
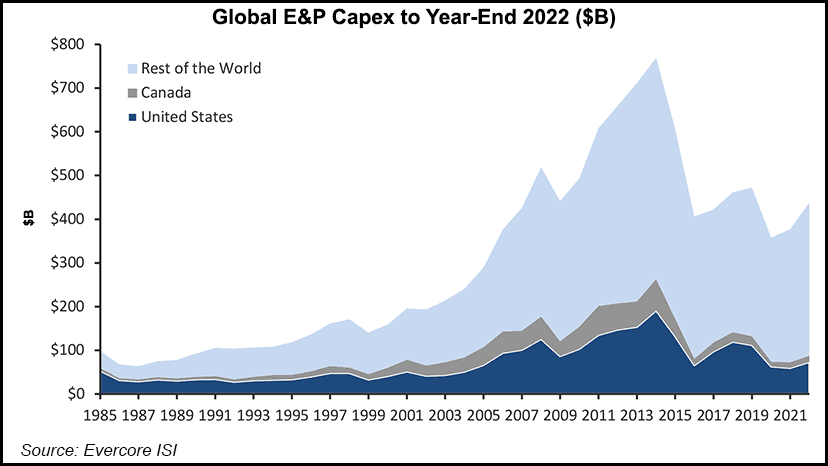
Oil and gas are inelastic commodities, meaning that supply does not change much when prices increase. The major cure for high prices is….high prices. In other words when the price gets so high demand is reduced.
Demand reduction will likely only take place at much higher prices. Some estimate that significant demand destruction will not occur until oil reaches $200 per barrel. Should the war continue and the world embargo Russian oil and gas, we will have a meaningful shortfall in global supply.
Having worked with a top energy long/short hedge fund, I learned a lot about how the energy industry works. Needless to say, there is little that we can do to increase supply in the short term, therefore we will just have to stomach higher prices for some time. While the forward Brent curve does imply a reduction in price in the future months, this price is highly dependent on the course of the war.
While the US economy is much less energy intensive than it was in the 1970s (estimated at roughly 50% more efficient) energy prices do nonetheless have an impact on spending the power of consumers in real and psychological terms.
Commodities and War
The other effect of the war is on the broader commodities complex:
Russia is currently the 11th largest economy in the world with a $1.6T GDP just behind that of Canada and 20% less than Italy’s economy. In spite of Russia’s smaller economy, it accounts for a large percentage of the worlds’ commodity exports outside of energy. Commodities such as palladium, diamonds, platinum, iron ore, aluminum, nickel, copper, wheat, corn coming from Russia and Ukraine account for a high percentage of global supply (over 40% in the case of Palladium).
A reduction in the supply of these commodities has the biggest effect on Europe but does have global repercussions for many industries.
In general commodities and commodity producing countries are under owned as investments. This represents an opportunity for smart investors. The countries that have large resource exporting businesses are Brazil, Australia, Canada, South Africa. We have already seen this play out with the Brazilian markets up over 18% YTD.
Trade-off: Inflation VS. War
In the absence of the geopolitical situation in Ukraine, we would expect the Fed to increase rates fairly aggressively to cool inflation however given the Russian/Ukrainian, conflict that calculus is up for debate.
The Fed increased rates 25 bps on March 16th and Jerome Powell is guiding to 6 more increases this year. This still leaves real rates negative but this will have the effect of helping cool the economy and help manage inflation. I believe that they will be cautious and will adjust their policy so as not to tip the economy into a recession. While the probability of a recession has increased, we are not modeling a recession. My sense is they will tolerate more inflation to allow the economy to keep expanding.
The data would indicate that after rate hikes that equities are well supported after an initial drop. See the chart below.
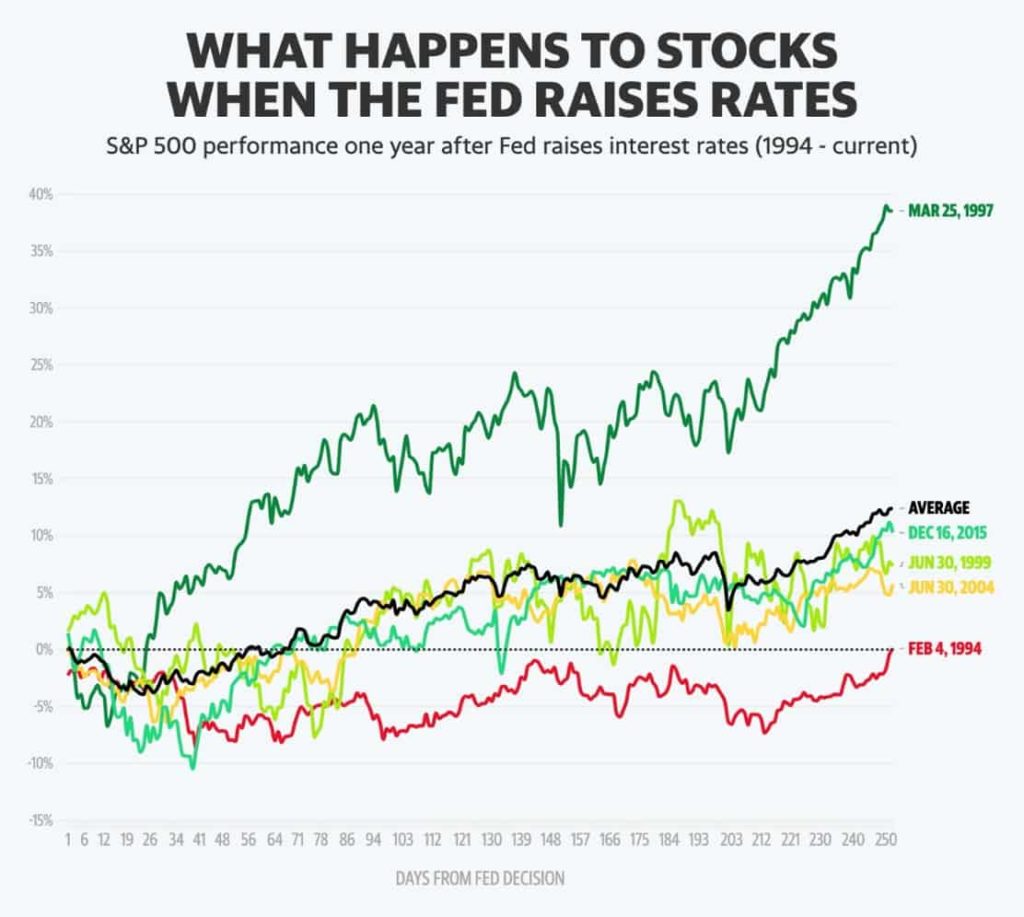
Risk and Uncertainty
To be human is to be stressed with what is happening in Ukraine. This emotional response is natural and can affect how we think and invest. The war has created big risks and uncertainties for investors. There are key differences, however, between risk and uncertainty. We can manage risk with hedging, insurance and other strategies, but uncertainty is not manageable and demands flexibility.
One doesn’t know how the war in Ukraine will unfold.
● When will it end?
● Will Russia stop at Ukraine or be aggressive with other countries?
● What will the effect be on the US Dollar?
● Will the dollar lose influence as Russia trades more in Yuan or crypto?
● What effect will the sanctions have on supply chains and movements of money?
● What exposure do Western banks have to Russian counter-parties?
● How does China respond?
● Will the comparative advantage of free trade be restricted, if so for how long?
What can be said for certain is that there are many unknowns and uncertainties which will result in market volatility. We are likely to see increases in equity, rates, FX and commodity volatility.
HOw to position portfolios
History would indicate that it is best to invest when fear is high. While this is hard to do, it can provide great returns. I added to investments at the depths of 2009 and 2020 and have learned to assimilate lots of data and listen to my gut.
As discussed above, one area of investing that is likely to benefit is volatility. So how does one profit from volatility?
1. Long Volatility
Long volatility strategies benefit from higher market volatility. Quantitative, global macro and trend following strategies have elements of being long volatility.
I have deep experience in this sector with a personal history of allocating hundreds of millions of dollars in this space. I have identified a particular fund manager that profits when market dislocations happen. This particular fund has a negative correlation to the S&P and has provided nearly double the return of the S&P since inception. Inclusion of investments like this may improve a client’s total portfolio return at the same time dampening the overall risk.
2. Inflation Sensitive Equities
Certain sectors of the economy are more sensitive to inflation than others. In general, equities are good long term hedges against inflation as companies are generally able to pass along higher input costs to consumers. Some equity sectors are better able to cope with inflation than others. The best sectors as inflation hedges are: precious metals, consumer staples, utilities, real estate, materials and financials.
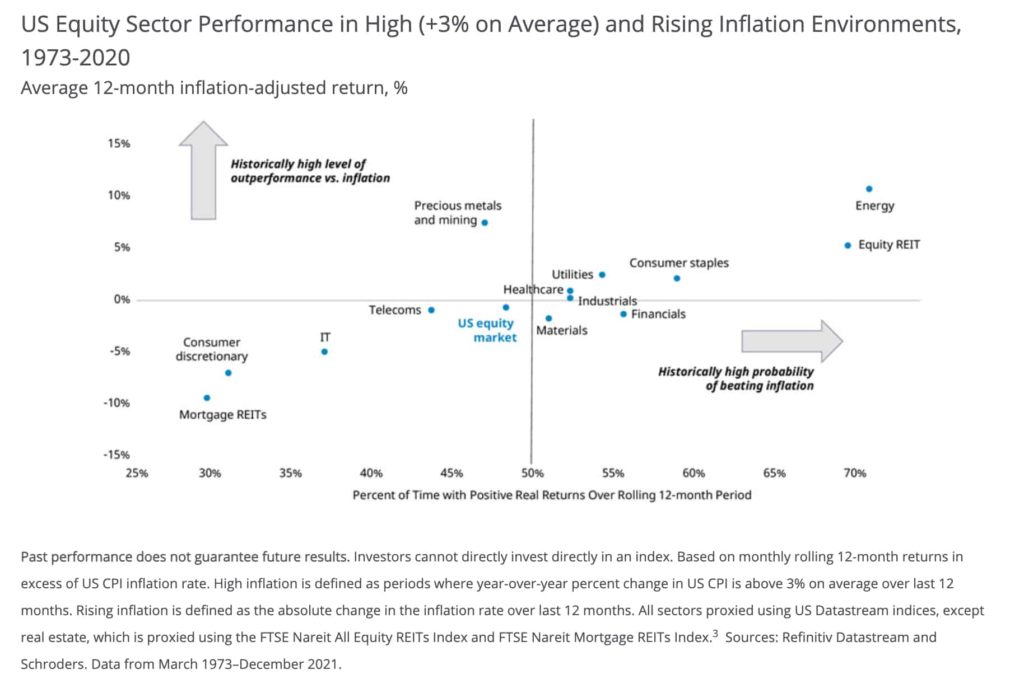
3. Debtor Strategies and Short Duration Assets
When rates are rising one wants to keep debt investments short in duration and/or own adjustable rate debt instruments. There are many interesting ways to capture increased rates via high quality floating rate bonds or by owning short duration loans that cycle quickly, such as short duration real estate bridge loans.
4. Extend Debt and Increase Leverage
One personal finance strategy is to extend debt obligations. For individuals, this might mean refinancing out of a floating rate mortgage into a 30-year fixed rate mortgage. For companies, this means issuing long duration debt. If inflation is persistent, then the debt service payments that one makes are devalued with each year that passes. Let inflation do the work for you.
5. Real Estate
Certain types of real estate can act as a good inflation hedge. Real estate sectors that have frequent payment resets tend to grow income over time and keep up with or exceed inflation.

Single or multi-family rentals, storage real estate as some that have allocated to. Rent payments are typically adjusted annually and typically adjust with a positive correlation to wages and inflation. Owning this type of real estate is like owning a bond that has an increasing coupon and future principal payment.
6. Resources and Resource Rich Countries
Certain materials and natural resources are undersupplied. With supply further constrained by the Russia conflict, this area of investing may provide good long term areas for allocation. If you factor in demand from a net-zero carbon world the forecasted need for resources increases even more. See the charts below from the International Energy Association (IEA) projections for demand for copper, nickel, cobalt and lithium.
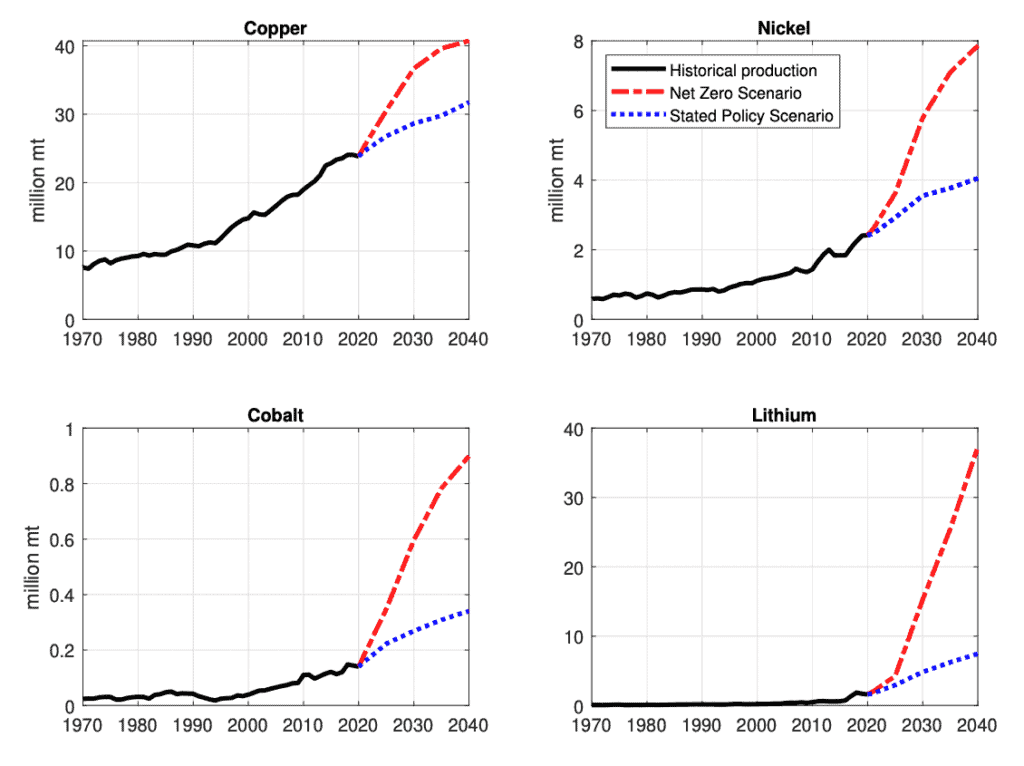
Allocating to countries that will benefit from increased resource demand are likely to benefit two-fold: One the companies that are producing the resources are likely have higher earnings power and two the country’s currency is likely to appreciate. This has the potential to benefit the investor on both fronts. We like investments in Brazil and select individual resource companies.
7. Value Equities
Creating an equity allocation strategy that includes growth and value can provide portfolio balance. In inflationary environments, high P/E stocks tend not to perform as well as low P/E stocks. In this environment, we tend to tilt more than usual to value equities and blue-chip growth companies.
I hope that you enjoyed this article. I look forward to discussing and/or debating these ideas with you.
Sincerely,
Brian
Disclosures*
This research note/blog post is for illustration and discussion purposes only. It is not intended to be, nor should it be construed or used as, investment, tax, ERISA or legal advice, nor any recommendation of, or an offer to sell, or a solicitation of any offer to buy, an interest in any security. Advisory Services are only offered to clients or prospective clients where Soaring Capital Management, LLC and its representatives are properly licensed or exempt from licensure. Investing involves risk and possible loss of principal capital. No advice may be rendered by Soaring Capital Management, LLC unless a client service agreement is in place.
Pro-forma portfolio illustrations shown are represented gross of advisory fees and expenses and presumes the reinvestment of investment income. Any descriptions involving investment models, statistical analysis, investment process and investment strategies and styles are provided for illustration purposes only. Client investments will vary based on the unique goals, objectives and other factors. No representation or warranty is made that any Soaring Capital Management, LLC investment portfolio, process or investment objectives will or are likely to be achieved or successful or will make any profit or will not sustain losses. Past performance is not indicative of future results.
The information contained herein is as of the date indicated, is not complete, is subject to change, and does not contain all material information, including information relating to risk factors. Any assumptions, assessments, intended targets, statements or the like (collectively, “Statements”) regarding future events or which are forward-looking in nature constitute only subjective views, outlooks, estimations or intentions, are based upon Soaring Capital’s expectations, intentions or beliefs, should not be relied on, are subject to change due to a variety of factors, including fluctuating market conditions and economic factors, and involve inherent risks and uncertainties, both general and specific, many of which cannot be predicted or quantified and are beyond Soaring Capital’s control. Future evidence and actual results could differ materially from those set forth in, contemplated by, or underlying these Statements. In light of these risks and uncertainties, there can be no assurance and no representation given that these Statements are now or will prove to be accurate or complete in any way. Soaring Capital undertakes no responsibility or obligation to revise or update such Statements.
Return targets or objectives, if any, are used for measurement or comparison purposes and only as a guideline for prospective investors to evaluate a particular investment program’s investment strategies and accompanying information. Targeted returns reflect subjective determinations by Soaring Capital based on a variety of factors, including, among others, investment strategy, prior performance of similar products (if any), volatility measures, risk tolerance and market conditions. Performance may fluctuate, especially over short periods. Targeted returns should be evaluated over the time period indicated and not over shorter periods. Targeted returns are not intended to be actual performance and should not be relied upon as an indication of actual or future performance.
This research note is not intended for distribution to or use by any person or entity in any jurisdiction or country where such distribution or use would be contrary to local law or regulation.
The post Profiting from Inflation, Volatility and Uncertainty appeared first on Soaring Capital Management, LLC.
]]>The post Broker versus Advisor – Five Key Distinctions appeared first on Soaring Capital Management, LLC.
]]>
Most people visit a doctor when they are sick. They don’t see a pharmaceutical sales person to discuss what medicines they are currently marketing. Frequently, however, this is what happens when individuals are looking for financial advice. Individuals are often persuaded to purchase a financial product that their broker is marketing without truly knowing if it is the best one to meet their needs.
Getting the right financial advice can significantly increase the odds of long-term financial success. Choosing the right advisor has the potential to result in over $1 million dollars in additional wealth. (see illustration in section 3 below)*
How does one increase the chances of getting the right financial advice?
There are a couple of key considerations that are important to understand about the world of financial services that will dramatically improve one’s odds of success. The five most important factors are:
- Understanding the difference between brokers and advisors.
- Being aware of conflicts of interest.
- Quantifying and monitoring investment costs.
- Understanding the different levels of asset protection.
- Understanding the range of investments and ideas different types of firms can offer.
1. Brokers are different from fiduciary registered investment advisors
One of the most important considerations when hiring a firm to manage your finances is to understand the differences between a broker and a fiduciary registered investment advisor (RIA).
Brokers are focused on sales of investment products versus longer term wealth accumulation and client wealth planning.
There are two main reasons why the distinction between broker and advisor is so important:
1. Alignment of Interests – Registered investment advisors’ interests are better aligned with their clients’ interests due to the compensation structure as well as legal obligations. Brokers/brokerage firms are sales oriented and earn commissions for selling investment products while registered investment advisors are focused on wealth accumulation and wealth planning and do not earn sales commissions. Fiduciary investment advisors are typically compensated under a flat fee arrangement and only earn more if the client earns more.
Brokers/brokerage firms are sales oriented and earn commissions for selling investment products while registered investment advisors are focused on wealth accumulation and wealth planning and do not earn sales commissions. Fiduciary investment advisors are typically compensated under a flat fee arrangement and only earn more if the client earns more.
A broker/brokerage firms’ interest might not be completely aligned with consumers as the investment products that are often sold to the client are the products that produce the highest level of commission for the broker. Consumers who work with registered investment advisors will by law receive a solution that is in the clients best interest.
2. Fiduciary Standards – There are material differences between the standards of care that a broker must adhere to versus that of a registered investment advisor. While the fiduciary requirements for brokers have been strengthened in recent years, they are far behind those of a registered investment advisor. The fiduciary requirements for Advisors are laid out by the SEC and can be found here.
In summary, registered investment advisors must:
- Operate at the highest level of fiduciary care and are legally bound to always put the interest of the client ahead of their own;
- Invest client’s assets in an optimal manner relative to their goals, objectives and risk tolerance and always do what is in the client’s best interest;
- Not charge commissions; and
- Avoid all conflicts of interest.
In the United States, there are over 600,000 wire-house brokers but only 13,000 who are qualified as registered investment advisors.*
It is worth noting that many investment firms are dually licensed as both brokers as well as registered investment advisors. This means that these firms can charge commissions when it is in their best interest to do so and then act as an advisor during other times. Under this “hat switching” arrangement, the client may not know when they are being treated as a brokerage client versus an advisory client.
One can use the SEC website at https://adviserinfo.sec.gov/ to search for firms and advisors to determine if they are a broker, advisor or dually registered.
2. Conflicts of INVESTMENT
Unless someone has worked in the finance industry, they may not be aware of the wide variety of potential conflicts of interest and how they might affect an investor.
Often, investment/brokerage firms have many divisions, each serving different constituents. Firms like Goldman Sachs, Morgan Stanley, JP Morgan, UBS, Bank of America Merrill Lynch, Raymond James and others have at least three legally distinct and different divisions within the company: 1) broker-dealer/brokerage; 2) asset management; and 3) wealth management. Each of these divisions are in inherent conflict with each other.
So where does the conflict of interest come into play?
A common example of a conflict of interest with these types of firms is when the broker invests client assets into an investment product that was created and managed by the asset management division of the same firm. Often, the broker will receive extra compensation or incentives if they invest their client’s assets into the firm’s own investment products.
What is wrong with this one might ask? For one the investment might not be the most suitable/appropriate investment for the client and second, it might be more expensive than other options available. When working with a registered investment advisor such as Soaring Capital, such a transaction would be unethical and in fact illegal.
Clients are typically unaware that they are paying extra and that there are cheaper, and just as effective and suitable, products available. Extra costs and high investment expenses can have long-term negative effect on the client’s investment performance and may jeopardize the financial well-being of the client. We’ll explore this topic in more detail below.
Investment expenses matter and can have a significant effect on investment performance over the long-term. A one percent lower cost investment portfolio, could result in a $1 million gain or more for the client over a 20-year period!
3. INVESTMENT EXPENSES
Investment expenses matter and can have a significant effect on investment performance over the long-term. A one percent lower cost investment portfolio, could result in a $1 million gain or more for the client over a 20-year period!
Clearly cost and expenses are important factors of investment success. An investment portfolio that is saddled with overly expensive investments can have a deleterious long-term effect on the overall return that the client realizes. As with most aspects of investing, there are subtle but important considerations to be aware of. There are two main cost components to be mindful of:
- Expense Ratio – the cost of the investment products that are used in a portfolio
- Advisory/broker Fees – the cost of advisory/broker services.
Comparing the cost that a registered investment advisor charges for advice and ongoing management is easy to understand and transparent. This fee is clearly disclosed in the investment advisory agreement. However, the ongoing costs (expense ratio) and upfront fees for the investments in the client portfolio are much harder for the average investor to understand and compare.
The expense ratio information is often not disclosed or discussed with clients. Sometimes added costs can be layered into a portfolio by a broker recommending an in-house investment product or using a higher cost mutual fund when a lower cost and more tax efficient ETF would be preferred.The difference between a mutual fund with a sales charge (SEC 12b-1 fee) and an ETF could be a difference of 5%. This 5% directly impacts the amount of money that the client ultimately retains
The lower fee portfolio returned $1,100,000 more over a 20-year horizon!
As a simple illustration we compare the performance results for a client who invests $1,000,000 over a 20-year period. We assume that the only difference between the portfolios is the expense ratio. One portfolio has a cost/expense structure that is higher by 1%. The added expenses cause the portfolio to earn 9% annually vs. 10% annually for the lower expense structured portfolio. Each portfolio starts with a $1 investment. After 20-years, the lower expense portfolio ends with $1,100,000 HIGHER balance. ($5.6 million vs $6.7 million)!
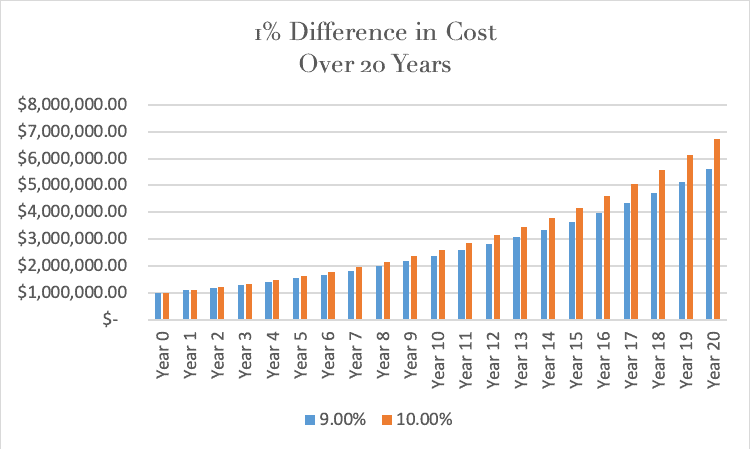
Soaring Capital recently started working with a new client. After analyzing the clients’ existing portfolio, we were able to reduce the number of investments, upgrade the quality of the investments, reduce the portfolio level risk and reduce the expense ratio by over 60%!
4. Protection of Assets
Often there is confusion regarding the different levels of protection investors have at different types of financial institutions and what the protection covers
When an investor has their money in a savings or checking account at a bank or credit union (or the banking division of an investment firm) the assets are protected by FDIC (Federal Deposit Insurance Company) up to $250,000 per account. However, the client loses these investor protections the moment the assets move to an investment account that is under the umbrella of a bank or credit union. [Same institution, different division.]
The perception of safety investing with a bank is false.
When working with a registered investment advisor, the assets are always held at a qualified SEC registered custodian in the name of the client. The client’s investment securities are covered by SIPC (Securities Investor Protection Corporation) up to $500,000 and cash held in the account is protected up to $250,000 per account.
It should be noted that registered investment advisors cannot withdrawal or transfer funds from the custodian (other than for payment of fees).
5. Access to research, resources and INVESTMENTs
One of the key benefits of working with an independent registered investment advisor is the open architecture nature of the platform. What this means is that we have access to virtually any:
- Investment product
- Investment research (including from Goldman Sachs, Morgan Stanley, , Blackrock, JP Morgan and others)
- Analytical tool
- Freedom of thought
Brokers or advisors at large firms are often limited to using only the firms’ approved and limited list of investment offerings, analytical tools and must invest client assets according to the view or asset assumptions that are set by the firm’s chief investment officer.
Independent registered investment advisors are open architecture, which means they have access to virtually any investment product that best suits the client’s need.
conclusion
In conclusion, when in need of financial advice, there are important things to keep in mind that will greatly improve your chances of success:
Broker vs Registered Investment Advisor – To receive unbiased advice, it is recommended that you hire a true fiduciary registered investment advisor and not a broker or hybrid, dually registered broker/advisor. Fiduciary registered investment advisors have a better alignment of interest with the client. Brokers operate under a sales commission model versus an advice, fee only model.
Fiduciary Standards Matter – Only registered investment advisors operate at the highest fiduciary standard which puts the clients’ interests ahead of the firm; avoids conflicts of interest; and does not charge sales commissions.
Conflicts of Interest – Wall Street is a multifaceted industry that frequently has conflicting divisions within the same firm. Knowing which division is servicing you will help you to understand the angle and perspective and potential conflicts of interest.
Investment Costs – It is imperative to keep investment expenses and fees low as high costs will have a material, negative impact on performance.
Protection of Assets – Banks/credit unions don’t provide additional asset protections versus registered investment advisors.
Access to Investments and Ideas – Registered investment advisors have access to virtually any investment offering and have freedom of thought whereas brokerage or large investment firms may limit the products available and make their brokers conform to the firm’s market outlook.
If you are interested in exploring what a fiduciary registered investment advisor can do for you please contact us using the button below.
Disclosures*
*Data sourced via FINRA at https://www.finra.org/media-center/statistics and FA Magazine https://www.fa-mag.com/news/ria-firms-top-record–110t-aum–60-million-clients–iaa-reports-62858.html
This research note is for illustration and discussion purposes only. It is not intended to be, nor should it be construed or used as, investment, tax, ERISA or legal advice, nor any recommendation of, or an offer to sell, or a solicitation of any offer to buy, an interest in any security. Advisory Services are only offered to clients or prospective clients where Soaring Capital Management, LLC and its representatives are properly licensed or exempt from licensure. Investing involves risk and possible loss of principal capital. No advice may be rendered by Soaring Capital Management, LLC unless a client service agreement is in place.
Pro-forma portfolio illustrations shown are represented gross of advisory fees and expenses and presumes the reinvestment of investment income. Any descriptions involving investment models, statistical analysis, investment process and investment strategies and styles are provided for illustration purposes only. Client investments will vary based on the unique goals, objectives and other factors. No representation or warranty is made that any Soaring Capital Management, LLC investment portfolio, process or investment objectives will or are likely to be achieved or successful or will make any profit or will not sustain losses. Past performance is not indicative of future results.
The information contained herein is as of the date indicated, is not complete, is subject to change, and does not contain all material information, including information relating to risk factors. Any assumptions, assessments, intended targets, statements or the like (collectively, “Statements”) regarding future events or which are forward-looking in nature constitute only subjective views, outlooks, estimations or intentions, are based upon Soaring Capital’s expectations, intentions or beliefs, should not be relied on, are subject to change due to a variety of factors, including fluctuating market conditions and economic factors, and involve inherent risks and uncertainties, both general and specific, many of which cannot be predicted or quantified and are beyond Soaring Capital’s control. Future evidence and actual results could differ materially from those set forth in, contemplated by, or underlying these Statements. In light of these risks and uncertainties, there can be no assurance and no representation given that these Statements are now or will prove to be accurate or complete in any way. Soaring Capital undertakes no responsibility or obligation to revise or update such Statements.
Return targets or objectives, if any, are used for measurement or comparison purposes and only as a guideline for prospective investors to evaluate a particular investment program’s investment strategies and accompanying information. Targeted returns reflect subjective determinations by Soaring Capital based on a variety of factors, including, among others, investment strategy, prior performance of similar products (if any), volatility measures, risk tolerance and market conditions. Performance may fluctuate, especially over short periods. Targeted returns should be evaluated over the time period indicated and not over shorter periods. Targeted returns are not intended to be actual performance and should not be relied upon as an indication of actual or future performance.
This research note is not intended for distribution to or use by any person or entity in any jurisdiction or country where such distribution or use would be contrary to local law or regulation.
The post Broker versus Advisor – Five Key Distinctions appeared first on Soaring Capital Management, LLC.
]]>