
Opportunity Zone Hypothetical Return Illustration
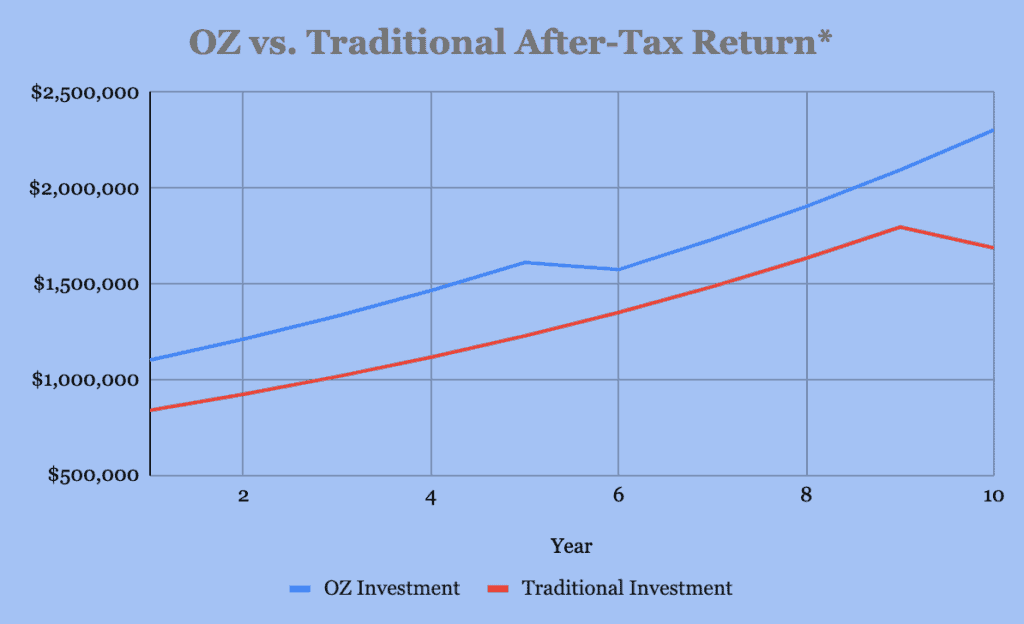
Below is an illustration of the hypothetical after-tax return of an investment in a Qualified Opportunity Zone Fund versus a traditional taxable investment. This shows how an Opportunity Zone investment may outperform by approximately 53 percent.*
This post is intended be read along with the broader research note titled “Five Hidden Tax Strategies to Use Now“.
One dimension by which to compare investments is the forecasted after-tax return. When constructing a portfolio and comparing investments for taxable investors the net after-tax return is an important factor to examine. The differences between pre and post tax returns with some investments can be large. Therefore, it is critical to model tax into the construction of an overall household investment plan.
This example assumes both investments produce an annual 10% nominal pre-tax return for a period of ten years and that the investor is reinvesting net gain proceeds from another investment.
See important disclosures at the bottom of this note.
The investment proceeds is assumed to be $1,000,000.
PART ONE: Opportunity Zone Fund After-Tax Return Analysis
Year One:
$1,000,000 capital gain invested in OZ Fund
Year Five:
$1,000,000 grows to $1,610,000 after 5 years at an assumed 10% rate of return.
Taxes are due on the original investment at year five. Cost basis is stepped up by 10% under OZ rules for investments made in 2021. Therefore $180,000 is due at this time (($1,000,000 x 0.9) x 20% = $180,000). The cost basis step up saves over $20,000. For this illustration, we assume that this is paid out of the OZ investment which leaves $1,430,000 at the end of the fifth year.
Year Five Through Ten:
$1,430,000 grows to $2,303,000 after 5 more years at an assumed 10% per annum return
Zero capital gains tax due on the $1,303,000 gain as per OZ rules
Remaining after capital gains deferral and capital gains elimination equals $2,303,000
Annualized rate of return after taxes is 8.7%
PART TWO: Traditional Investment After-Tax Return Analysis
Investing realized gains without using an Opportunity Zone Fund investment.
Year One:
$1,000,000 investment gain realized
$238,000 capital gains due ($1,000,000 x 23.8%)
$762,000 to invest in year one ($1,000,000 – $238,000)
Year Ten:
$762,000 grows to $1,976,000 after ten years at 10% per annum return
Taxes owed on the gain of $1,214,000 of investment equals $289,000 ($1,214,000 x 23.8%)
After taxes this leaves $1,738,000. ($1,976,000 – $289,000)
After tax rate of return without investing in OZ Fund equals 5.7% ($1,000,000 to $1,738,000 over 10 years is an annualized rate return of 5.7%)
Summary: After-Tax OZ Investment Returns 53% Higher Return
Investing in Qualified Opportunity Zone Fund may result in a 53% greater after-tax return versus a non-OZ Fund investment (8.7% vs. 5.7% = 52.6% difference)
Note: The 10% step up in cost basis in year five is only available for investments made in 2021.
Disclosures*
This note is for illustration and discussion purposes only. It is not intended to be, nor should it be construed or used as, investment, tax, ERISA or legal advice, nor any recommendation of, or an offer to sell, or a solicitation of any offer to buy, an interest in any security. Advisory Services are only offered to clients or prospective clients where Soaring Capital Management, LLC and its representatives are properly licensed or exempt from licensure. Investing involves risk and possible loss of principal capital. No advice may be rendered by Soaring Capital Management, LLC unless a client service agreement is in place.
Pro-forma portfolio illustrations shown are represented gross of advisory fees and expenses and presumes the reinvestment of investment income. Any descriptions involving investment models, statistical analysis, investment process and investment strategies and styles are provided for illustration purposes only. Client Investments will vary based on the unique goals, objectives and other factors. No representation or warranty is made that any Soaring Capital Management, LLC investment portfolio, process or investment objectives will or are likely to be achieved or successful or will make any profit or will not sustain losses. Past performance is not indicative of future results.
The information contained herein is as of the date indicated, is not complete, is subject to change, and does not contain all material information, including information relating to risk factors. Any assumptions, assessments, intended targets, statements or the like (collectively, “Statements”) regarding future events or which are forward-looking in nature constitute only subjective views, outlooks, estimations or intentions, are based upon Soaring Capital’s expectations, intentions or beliefs, should not be relied on, are subject to change due to a variety of factors, including fluctuating market conditions and economic factors, and involve inherent risks and uncertainties, both general and specific, many of which cannot be predicted or quantified and are beyond Soaring Capital’s control. Future evidence and actual results could differ materially from those set forth in, contemplated by, or underlying these Statements. In light of these risks and uncertainties, there can be no assurance and no representation given that these Statements are now or will prove to be accurate or complete in any way. Soaring Capital undertakes no responsibility or obligation to revise or update such Statements.
Return targets or objectives, if any, are used for measurement or comparison purposes and only as a guideline for prospective investors to evaluate a particular investment program’s investment strategies and accompanying information. Targeted returns reflect subjective determinations by Soaring Capital based on a variety of factors, including, among others, investment strategy, prior performance of similar products (if any), volatility measures, risk tolerance and market conditions. Performance may fluctuate, especially over short periods. Targeted returns should be evaluated over the time period indicated and not over shorter periods. Targeted returns are not intended to be actual performance and should not be relied upon as an indication of actual or future performance.
This research note is not intended for distribution to or use by any person or entity in any jurisdiction or country where such distribution or use would be contrary to local law or regulation.