
How Trump’s 2025 Tariff Plan is Reshaping Markets and Investor Strategy
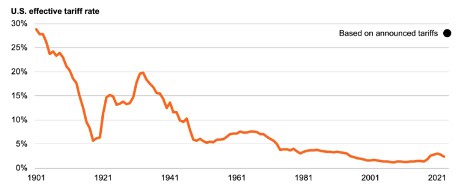
President Trump’s “Liberation Day” trade policy has significantly disrupted global financial markets by implementing tariffs at levels not seen since the early 1900s. The market reaction has been swift and severe, leaving few safe havens.
This research note reviews the rapidly changing news flow, examines market reactions and provides context on how to approach investing during this turbulent period.
On October 15th 2024, while speaking at the Economic Club of Chicago, then-candidate Donald Trump remarked that “tariff” is his favorite word – emphasizing his strong belief in using tariffs as a tool. He went on to say that it is “the most beautiful word in the dictionary”. Click here for video clip
Most market participants may now wish they had paid closer attention to his remarks.
Below is an overview of the tariff structure announced by White House:
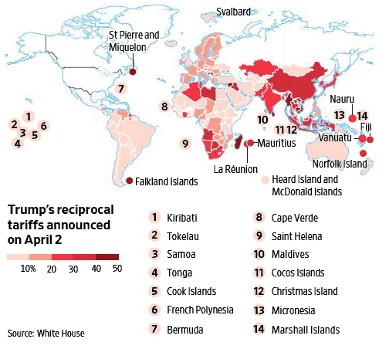
Tariffs were determined by a novel formula: the U.S. trade deficit with each country divided by imports, then halved (with a 10% minimum). This differs from traditional reciprocal tariffs and has raised questions about its economic rationale. The resulting effective tariff rate is approximately 22%.
As an example of how each tariff was determined: The U.S. exported $143b to China and China exported $438b in goods to the U.S. This resulted in a $295b trade deficit in 2024. Dividing the trade deficit by the value of imports yields 67%. Then, dividing this number by 2 results in a tariff rate of 34%.
This approach differs from traditional reciprocal tariffs and has raised questions about its economic rationale. The end result was an effective tariff rate of 22%.
Historical effective tariff rate:
It is no surprise that the financial markets have reacted negatively. Below is a summary of market performance as of Friday, April 4:

Significant Market Reactions
*Data through April 4, 2025
Broad U.S. Markets (Year-to-Date):
- S&P 500: down 13%
- Dow Jones: down 9.5%
- Nasdaq: down 19%
- Small-Cap Equities: down 18%
Select International Markets:
- Markets in China, Brazil, the UK, France, and Germany have posted gains between 5% and 10%.
Sector Performance:
- Decliners: Communication Services, Consumer Discretionary, and Information Technology sectors are down 14-22%.
- Resilient: Healthcare and utilities remain unchanged; consumer staples have posted gains.
Safe Havens:
- Gold: up 15%
- U.S. Bonds: up 4%
Currency Movement:
- The U.S. dollar has declined against major currencies—an unusual occurrence during risk-off periods.
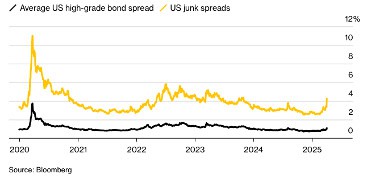
Credit Spreads:
- Corporate and high-yield credit spreads have widened significantly (to 109 and 427 basis points, respectively), reflecting increased market risk.
Volatility:
- The VIX index has spiked to 45.
Bond Market Expectations:
- The market is now pricing in five rate cuts by the Federal Reserve.
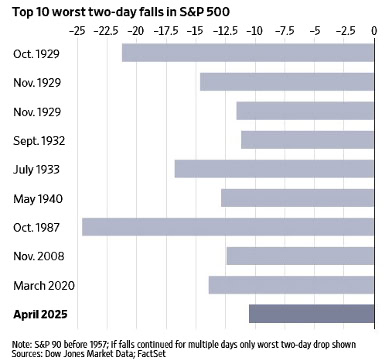
In historical context, these market reactions rank in the top 10 of two-day market declines going back to 1929!
Negotiating Salvo?
While financial markets reacted sharply, some analysts speculate this is an opening gambit. Treasury Secretary Bessent hinted the tariffs are a “ceiling” suggesting room for negotiation. Meanwhile Commerce Secretary Lutnick emphasized the goal of creating “a world of fairness.”
If Trump sticks to these tariffs, it will mark a major shift from cooperation to coercion in global trade that could have long-term consequences for U.S. economic influence and dollar dominance.
Historical evidence suggests that trade wars rarely reduce trade deficits or reverse the decline in manufacturing jobs, even for countries with trade surpluses. While there is merit in ensuring that the U.S. retains the capability to produce certain strategic and defense-related goods, many consumer products—such as apparel, footwear, or toys—benefit from international production efficiencies. Moreover, many U.S. manufacturers rely heavily on imported inputs (e.g., steel, aluminum, wood) to produce high-value goods. Taxing these imports could force manufacturers to either accept lower margins or pass on higher costs to consumers—both scenarios that are not favorable for financial markets.
Separately, we do believe that there are a significant number of unfair trade barriers, limits and quotas, non-tariff barriers and regulations that affect U.S. companies’ ability to operate freely in international markets.
It is worth noting that approximately 44% of the imports into the U.S. are used in finished goods that are made in the U.S. Steel, Aluminum, wood to name a few imports, are all heavily used by U.S. manufactures to make high value goods.
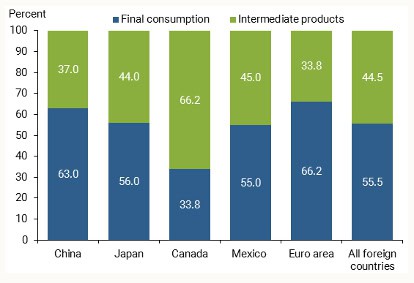
If we tax these goods, the makers of these products will either have to make lower margins or pass the added costs on to consumers. Either way this is not a positive scenario for the financial markets.
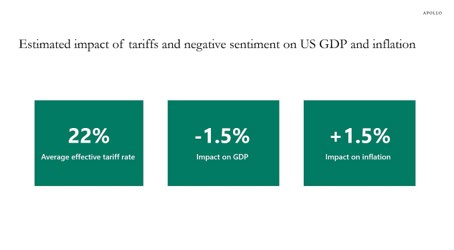
Investment and Economic Implications
Data from Apollo Asset Management suggests that a 22% effective tariff could reduce U.S. GDP by around 1.5% and increase inflation by a similar amount. Such a scenario would create a classic stagflation environment—simultaneously hampering economic growth and pushing up prices. In this scenario, the S&P 500 could potentially decline an additional 13-15% from current levels, pricing the index near 4,400 and compressing its P/E ratio to around 16. While this is not a forecast, it underscores the need to prepare for further volatility and to view any significant market declines as potential buying opportunities.
What is Working in this Crisis?
It is always instructive to observe how markets react in crises. This gives us a read through to positioning of participants and a road map to how to invest. Generally, the market behaved as expected with the exception of the weakness in the dollar.
- International Equities: International equities are offering stability, likely due to a rebalancing away from heavy U.S. equity weighting and under-valuation of foreign equity markets.
- Mid-Cap vs. Large-Cap: Mid-cap stocks are outperforming large caps, possibly due to an overweight in large-cap holdings.
- Bonds: Bonds are providing a safety net amid a flight-to-quality environment, supported by expectations of Federal Reserve rate cuts.
- Sector Analysis: Cyclical and discretionary sectors, particularly those reliant on imports, are more exposed to declines, while domestic consumer staples, utilities, and real estate tend to hold up better.
Strategic Recommendations
Our investment approach is built on balance diversification, avoiding heavy concentrations in any single company, sector or geography. We attempt to allocate to where there is value and non-correlated assets. This led us to have heavier allocations to foreign markets, gold, quantitative strategies, private credit, bonds and tilt away from large cap growth equity.
When we invest for our clients, we take a balanced approach and we do not have large concentrations in any one company, sector, asset type or geography. In addition to a blend of US equity, our current portfolio allocations include gold, international equity, quantitative strategies, private credit and bonds. This posture has provided outstanding relative performance.
While we will generally stay the course, we will look for tax loss harvesting opportunities. This refers to selling any holdings that might be at a loss. This action captures the tax loss which can b be used to offset gains. We then will then buy similar securities to maintain the same exposure. While this won’t create performance it will improve after-tax returns.
This diversified posture has historically delivered strong relative performance. We recommend:
- Maintain Long-Term Perspective: Market volatility is normal; reactive decisions often prove counterproductive
- Embrace Diversification: Ensure you hold a balanced mix of asset classes, sectors, and geographies
- Focus on Quality: Prioritize financially strong companies with sustainable business models
- Review Liquidity Needs: Ensure portfolio alignment with short/medium-term requirements
- Consider Rebalancing: Market dislocations may offer opportunities to adjust allocations
One has to keep in mind that the S&P 500 has never been down more than 10% at the end of any 5-year period following all-time highs and that the difference between investing at market highs only resulted in a 1% lower return through time. Staying invested and balanced resulted in the best long-term outcome.
Second Order Effects
If these tariffs become permanent, we may see some countries retaliate with reciprocal tariffs, as China has done. Other nations may be forced to accept the tariffs, prompting companies in those countries to innovate and improve efficiency to offset the added costs. In contrast, U.S. manufacturers may stagnate if shielded by tariff protections, potentially reducing incentives for innovation—a pattern similar to the decline of British manufacturing in the late 19th century as the U.S. emerged as the global industrial leader.
Additionally, there may be a realignment of global trade relationships. Countries outside the U.S. sphere of influence might increase bilateral trade—such as between Europe and China, or Japan and China. On the policy side, the tariffs might drive efforts to reduce the U.S. fiscal deficit, as lower tax revenues and higher debt servicing costs could eventually choke off economic growth.
The benefits of the tariffs outside of potentially bringing some manufacturing back to the U.S., might be that they raise significant revenue. Capital Economics estimates that the tariffs will create $700b in incremental revenue. This revenue can be used to reduce the debt and/or reduce taxes. There are a lot of assumptions in this figure, but nonetheless the tariffs should be net revenue positive for the U.S.
Any additional revenue is of major importance to the long-term health of the U.S. The U.S. has not had a balanced budget in 24 years. If tariffs can lead to more revenue we can help reduce this imbalance. Today, the U.S. total debt is $35 trillion and growing. While I am skeptical of the amount of money that tariffs can bring in, any revenue should be a net positive from a debt perspective.
Conclusion
While President Trump’s trade policies have created significant market disruption, history suggests that disciplined investing remains paramount. The shock from these tariffs may be temporary, and a swift policy reversal could trigger a market rebound similar to past episodes. The current environment is markedly different from the broad-based economic weakness seen in the 20028 Great Recession – it is largely self-imposed and may be reversible. Whether it will be reversed is the big unknown.
What we know about Trump is that he wants a deal. In this game of global economic chicken, will he be able to claim a victory and score a deal in the near term? No one knows for certain, but my money is that he will at least arrive at a compromise.
What we do know is that if you have a well-balanced portfolio, that is client-appropriate, tends to yield better long-term results than attempting to time the market.
The core economic drivers—employment, monetary policy, corporate earnings, and fiscal policy continue to provide a solid foundation for potential market recovery.
Brian F. Moss, CFA
Founder and CEO
Soaring Capital Management, LLC
Click here to read additional research from Soaring Capital
We help you chart the path that leads to your financial success.
Disclosures*
This research note is for illustration and discussion purposes only. It is not intended to be, nor should it be construed or used as, investment, tax, ERISA or legal advice, nor any recommendation of, or an offer to sell, or a solicitation of any offer to buy, an interest in any security. Advisory Services are only offered to clients or prospective clients where Soaring Capital Management, LLC and its representatives are properly licensed or exempt from licensure. Investing involves risk and possible loss of principal capital. No advice may be rendered by Soaring Capital Management, LLC unless a client service agreement is in place.
Pro-forma portfolio illustrations shown are represented gross of advisory fees and expenses and presumes the reinvestment of investment income. Any descriptions involving investment models, statistical analysis, investment process and investment strategies and styles are provided for illustration purposes only. Client investments will vary based on the unique goals, objectives and other factors. No representation or warranty is made that any Soaring Capital Management, LLC investment portfolio, process or investment objectives will or are likely to be achieved or successful or will make any profit or will not sustain losses. Past performance is not indicative of future results.
The information contained herein is as of the date indicated, is not complete, is subject to change, and does not contain all material information, including information relating to risk factors. Any assumptions, assessments, intended targets, statements or the like (collectively, “Statements”) regarding future events or which are forward-looking in nature constitute only subjective views, outlooks, estimations or intentions, are based upon Soaring Capital’s expectations, intentions or beliefs, should not be relied on, are subject to change due to a variety of factors, including fluctuating market conditions and economic factors, and involve inherent risks and uncertainties, both general and specific, many of which cannot be predicted or quantified and are beyond Soaring Capital’s control.
Future evidence and actual results could differ materially from those set forth in, contemplated by, or underlying these Statements. In light of these risks and uncertainties, there can be no assurance and no representation given that these Statements are now or will prove to be accurate or complete in anyway. Soaring Capital undertakes no responsibility or obligation to revise or update such Statements.
Return targets or objectives, if any, are used for measurement or comparison purposes and only as a guideline for prospective investors to evaluate a particular investment program’s investment strategies and accompanying information. Targeted returns reflect subjective determinations by Soaring Capital based on a variety of factors, including, among others, investment strategy, prior performance of similar products (if any), volatility measures, risk tolerance and market conditions. Performance may fluctuate, especially over short periods. Targeted returns should be evaluated over the time period indicated and not over shorter periods. Targeted returns are not intended to be actual performance and should not be relied upon as an indication of actual or future performance.
This research note is not intended for distribution to or use by any person or entity in any jurisdiction or country where such distribution or use would be contrary to local law or regulation.